Microsoft ($MSFT) Deep Dive

Microsoft stock is currently in a technical bear market; it’s down 24% since the ATH roughly a year ago, mostly due to the AI disruption fears affecting general software stocks. In this deep dive, we’ll go through how Microsoft is one of the most well-positioned companies to profit from the current transition of power to those who already have distribution built in and can upsell AI features into existing solutions for the existing clients. Microsoft is primed for that, the company serves over 3.7 million companies globally using Microsoft 365, multinational corporations and over 60% of the Fortune 500.
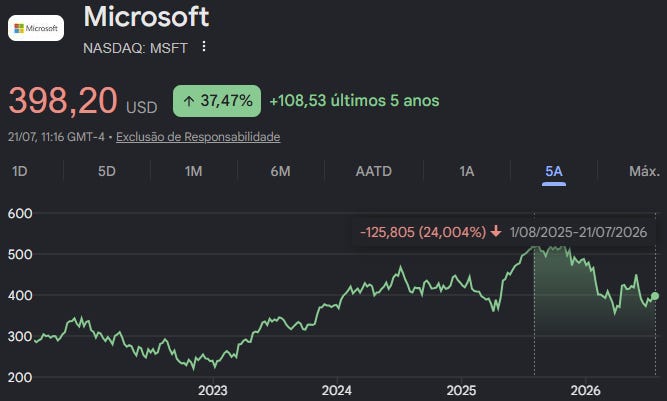
Throughout this article, we’ll analyze why Microsoft is trading at 2020 valuation lows and whether the fundamentals lead to a misvaluation in large-cap technology or if the market is right to penalize it and the company isn’t positioned to monetize AI across every layer of the stack for the next few years.
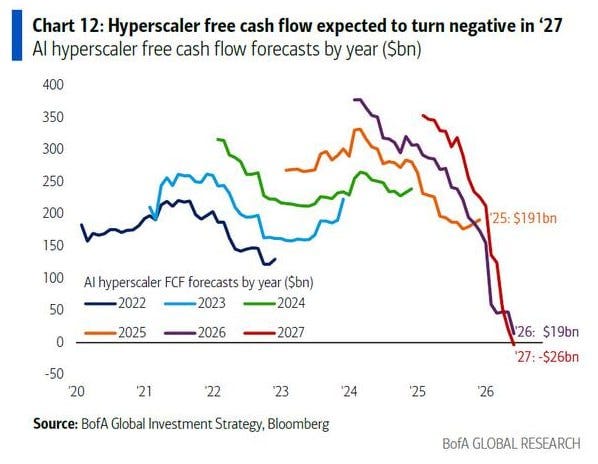
Besides the software side of Microsoft being affected by the SaaSpocalypse, the stock downturn is also attributable to investors growing wary of the massive CapEx that hyperscalers are deploying into AI-related infrastructure. In the most recent quarter, Microsoft’s CapEx was roughly $31B, with a management guidance of $190B for FY2026. Together, hyperscalers are expected to generate only $19B in FCF this fiscal year, compared to $191B in 2025, before turning negative to -$26B in FY2027. The market is questioning whether these record-high levels of spend are effectively going to deliver a satisfactory ROI, which has been punishing these stocks for the past year.
Another reason for the recent stock underperformance is the OpenAI concentration, approximately 45% of Microsoft’s $625B contract backlog is tied to it. Azure is growing 40% YoY in general terms, but only 26% excluding OpenAI’s commitments. These growth levels raise questions about whether the amounts being invested in the cloud business are actually justified by the expansion in this segment.
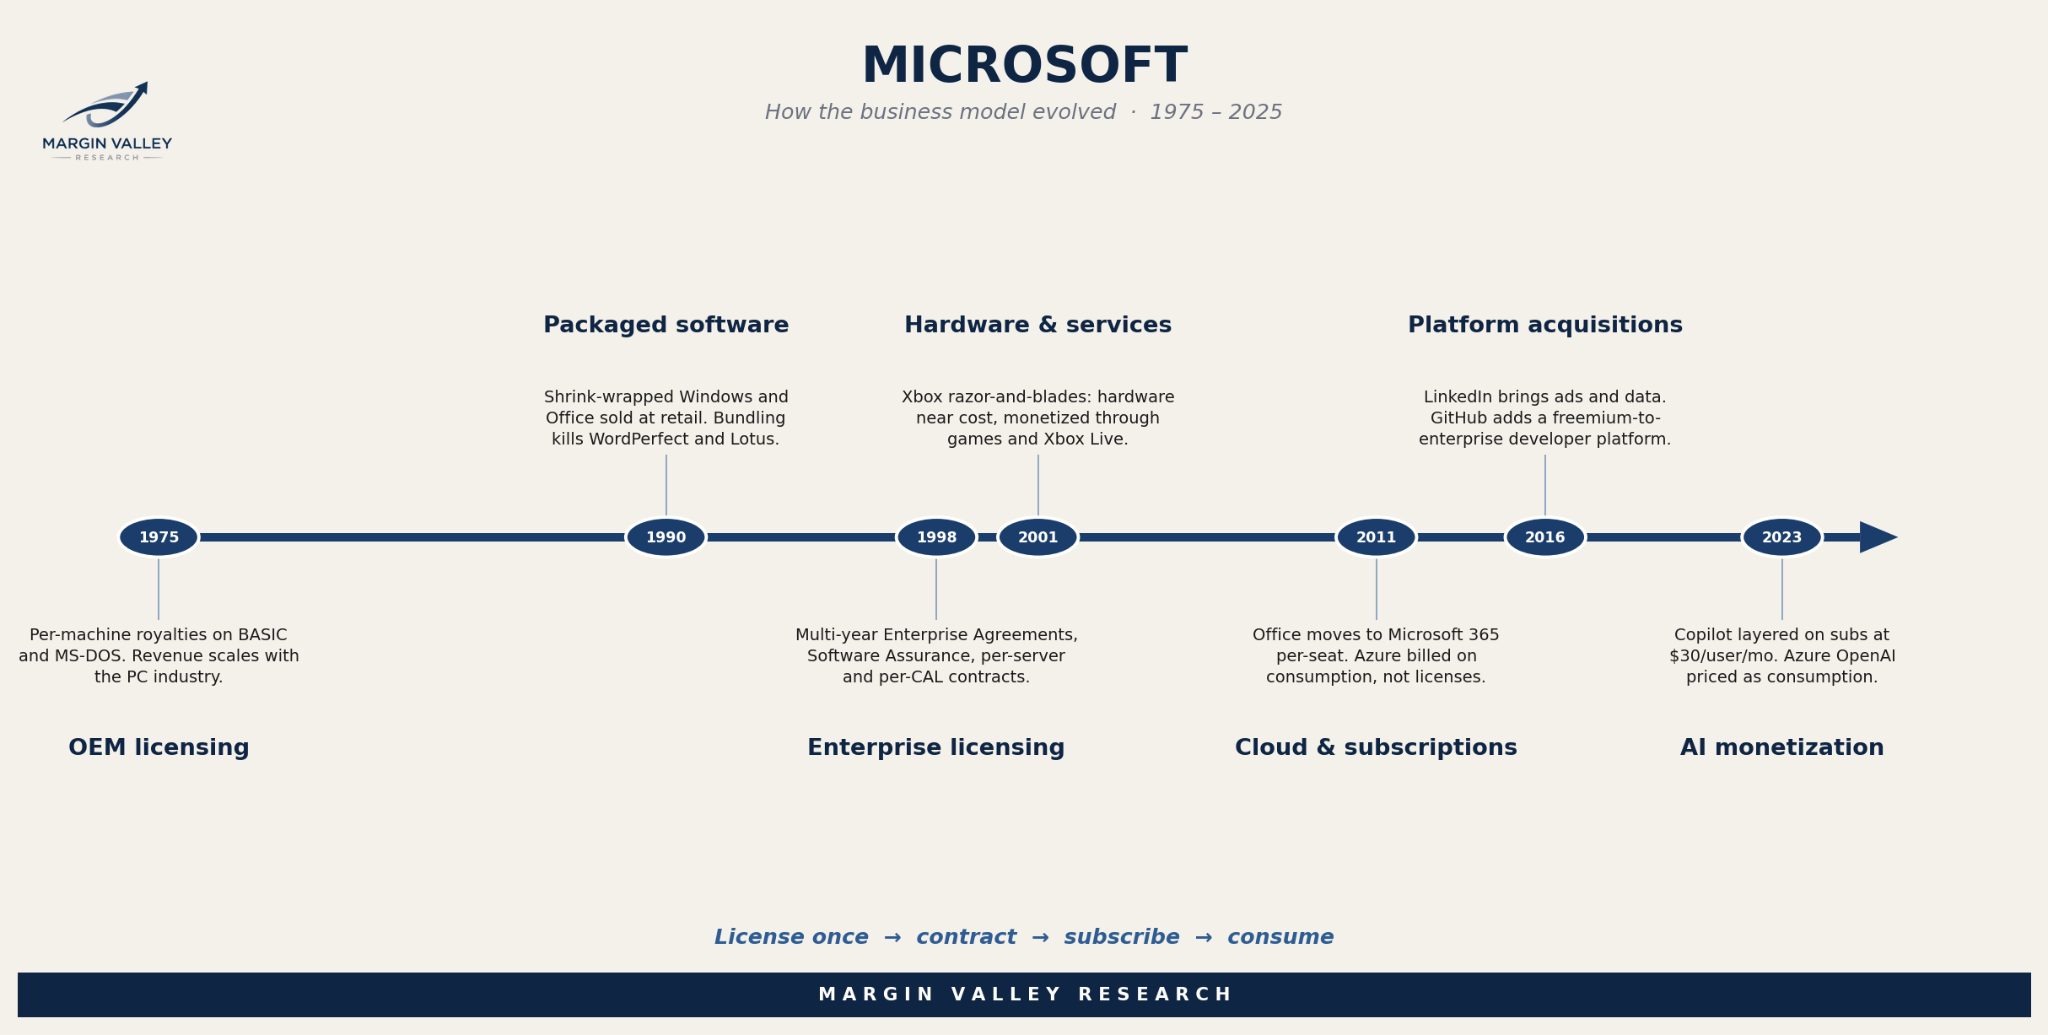
Throughout Microsoft’s journey since it was founded in 1975, the company has always adapted and profited from technological revolutions that raised disruption worries. In the past 3 years, the business model switched from asset-light SaaS to capital-intensive AI infrastructure (Azure). From 2023 onwards, the company combines its high-margin enterprise software ecosystem with the hyperscale cloud infrastructure that sits beneath every modern enterprise workload. Microsoft 365 itself has moved from a per-seat subscription model into a consumption-based one.
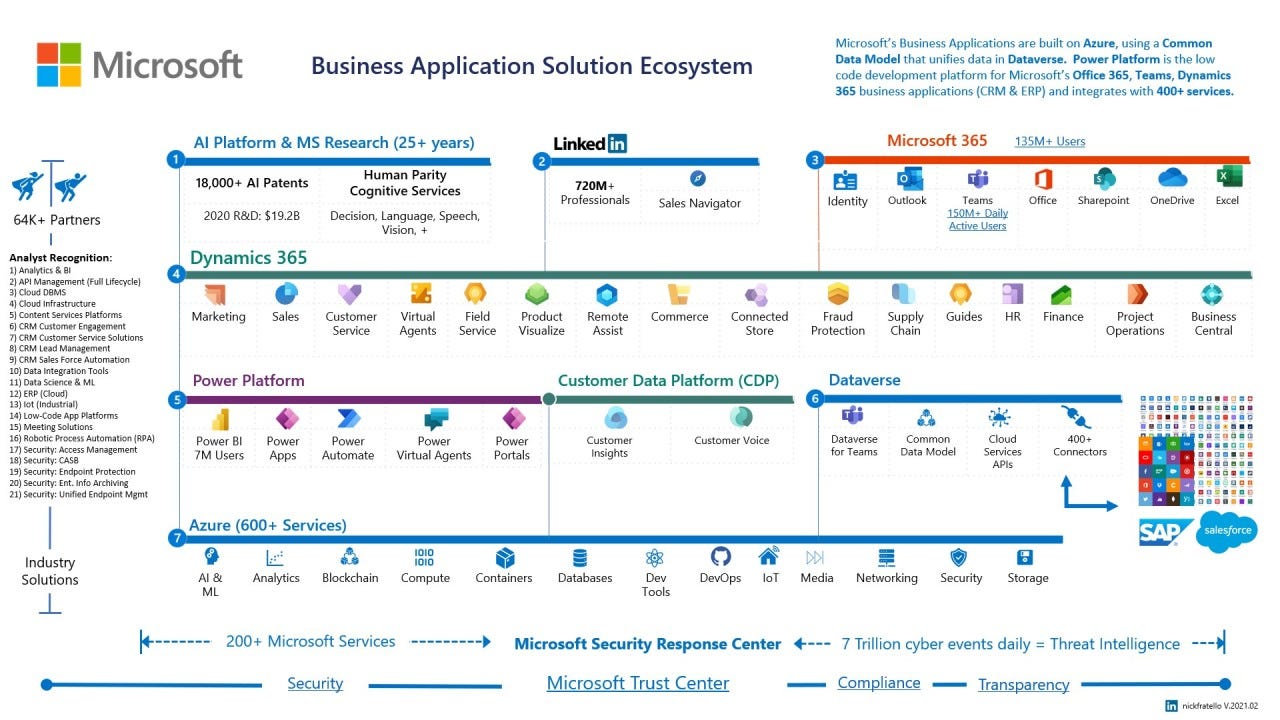
Table of content:
Executive summary & thesis
History
Business Overview & segment map
AI CapEx cycle
OpenAI relationship
Usage-based monetization transition
Moat & Competitive Position by Segment
Financial Analysis
Management & Governance
Risks
Valuation
Conclusion
2. History
Before evaluating Microsoft’s future prospects, it’s important to understand every phase it went through in order to get here.
1975–1980: The BASIC years
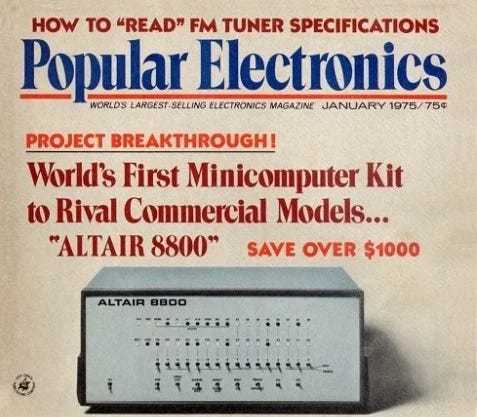
Bill Gates and Paul Allen founded Microsoft in April 1975 in Albuquerque, New Mexico, after seeing the MITS Altair 8800 on the cover of Popular Electronics. Their first product was a BASIC interpreter for the Altair. Their vision was that software, not hardware, would be the way of building a durable business, which inspired the creation of Microsoft. They moved to Bellevue, Washington in 1979.
1980–1990: The IBM deal and the DOS monopoly
This was a make-or-break moment. In 1980 IBM was rushing its PC to market and needed an operating system. Microsoft didn’t have one. Gates bought QDOS from Seattle Computer Products for $75,000, adapted it, and licensed it to IBM as PC-DOS, on a non-exclusive basis. That let Microsoft sell the same OS as MS-DOS to every IBM clone maker (Compaq, Dell, and so on). IBM commoditized the hardware while Microsoft owned the software layer that ran on all of it. That is the single most important business decision in the company’s history.
Windows 1.0 shipped in 1985 as a graphical shell on top of DOS. The company IPO’d in March 1986 at $21/share, making Gates a billionaire the following year.
1990–2000: The Windows/Office duopoly and the antitrust wall
Windows 3.0 (1990) was the breakout, and Windows 95 (1995) was the play that scaled the brand into customer preferences. The company paid the Rolling Stones $3 million to use their hit song “Start Me Up” for the launch, and it got midnight lines at stores. Office bundled Word, Excel, and PowerPoint into the productivity standard and crushed WordPerfect and Lotus 1-2-3. By the late 1990s Microsoft had ~90%+ share of desktop OS and productivity software. Cash flows were extraordinary.
Then two things happened. First, Microsoft missed the internet initially, then launched Internet Explorer, bundling it with Windows to kill Netscape. Second, the DOJ sued in 1998. United States v. Microsoft found the company had illegally maintained its monopoly. The remedy (a breakup) was reversed on appeal and settled in 2001, but the distraction was enormous. Gates stepped down as CEO in January 2000 and Steve Ballmer took over.
2000–2014: The Ballmer era
Under Ballmer, Microsoft’s revenue and profits grew substantially, Windows and Office became cash machines, along with Server & Tools (Windows Server, SQL Server). Xbox launched in 2001 and became a genuine gaming business. Azure launched in 2010.
But strategically, the company missed almost every major platform shift of the era:
Search: ceded to Google. Bing launched in 2009, never caught up.
Mobile: Windows Mobile / Windows Phone was late and lost. The $7.2B Nokia acquisition in 2014 was written down almost entirely.
Consumer internet/social: not a factor.
Zune, Kin, Vista: product missteps that damaged the brand.
The stock reflected it by trading roughly flat from 2000 to 2013 while earnings grew. This was mostly due to multiple compression from a dot-com peak, plus the market’s view that Microsoft was a legacy PC business in secular decline.
2014–present: The Nadella reset
Satya Nadella became CEO in February 2014, and the strategic pivot is one of the best-executed CEO transitions in tech history.
Cloud-first: Azure went from a side project to the #2 hyperscaler globally, and Microsoft repositioned Office as Office 365 / Microsoft 365, a recurring subscription business with far better economics than perpetual licenses.
Cultural shift: the Windows-first strategy was abandoned. Office came to iOS and Android. Microsoft embraced Linux (SQL Server on Linux, WSL).
Strategic M&A: LinkedIn in 2016 for $26B, GitHub in 2018 for $7.5B, Activision Blizzard in 2023 for ~$69B.
The OpenAI bet: Initial investment in 2019, expanded to a reported ~$13B, which gave Microsoft a privileged position in the generative AI wave. Copilot was introduced across the product suite, Azure OpenAI Service for the enterprise segment. This initial positioning in generative AI led to the stock re-rating seen after 2023.
Financially, the numbers went from good to extraordinary. Market cap crossed $1T in 2019, $2T in 2021, $3T in 2024. Operating margins in the 40%+ range on a business this size is remarkable.
3. Business Overview & segment map
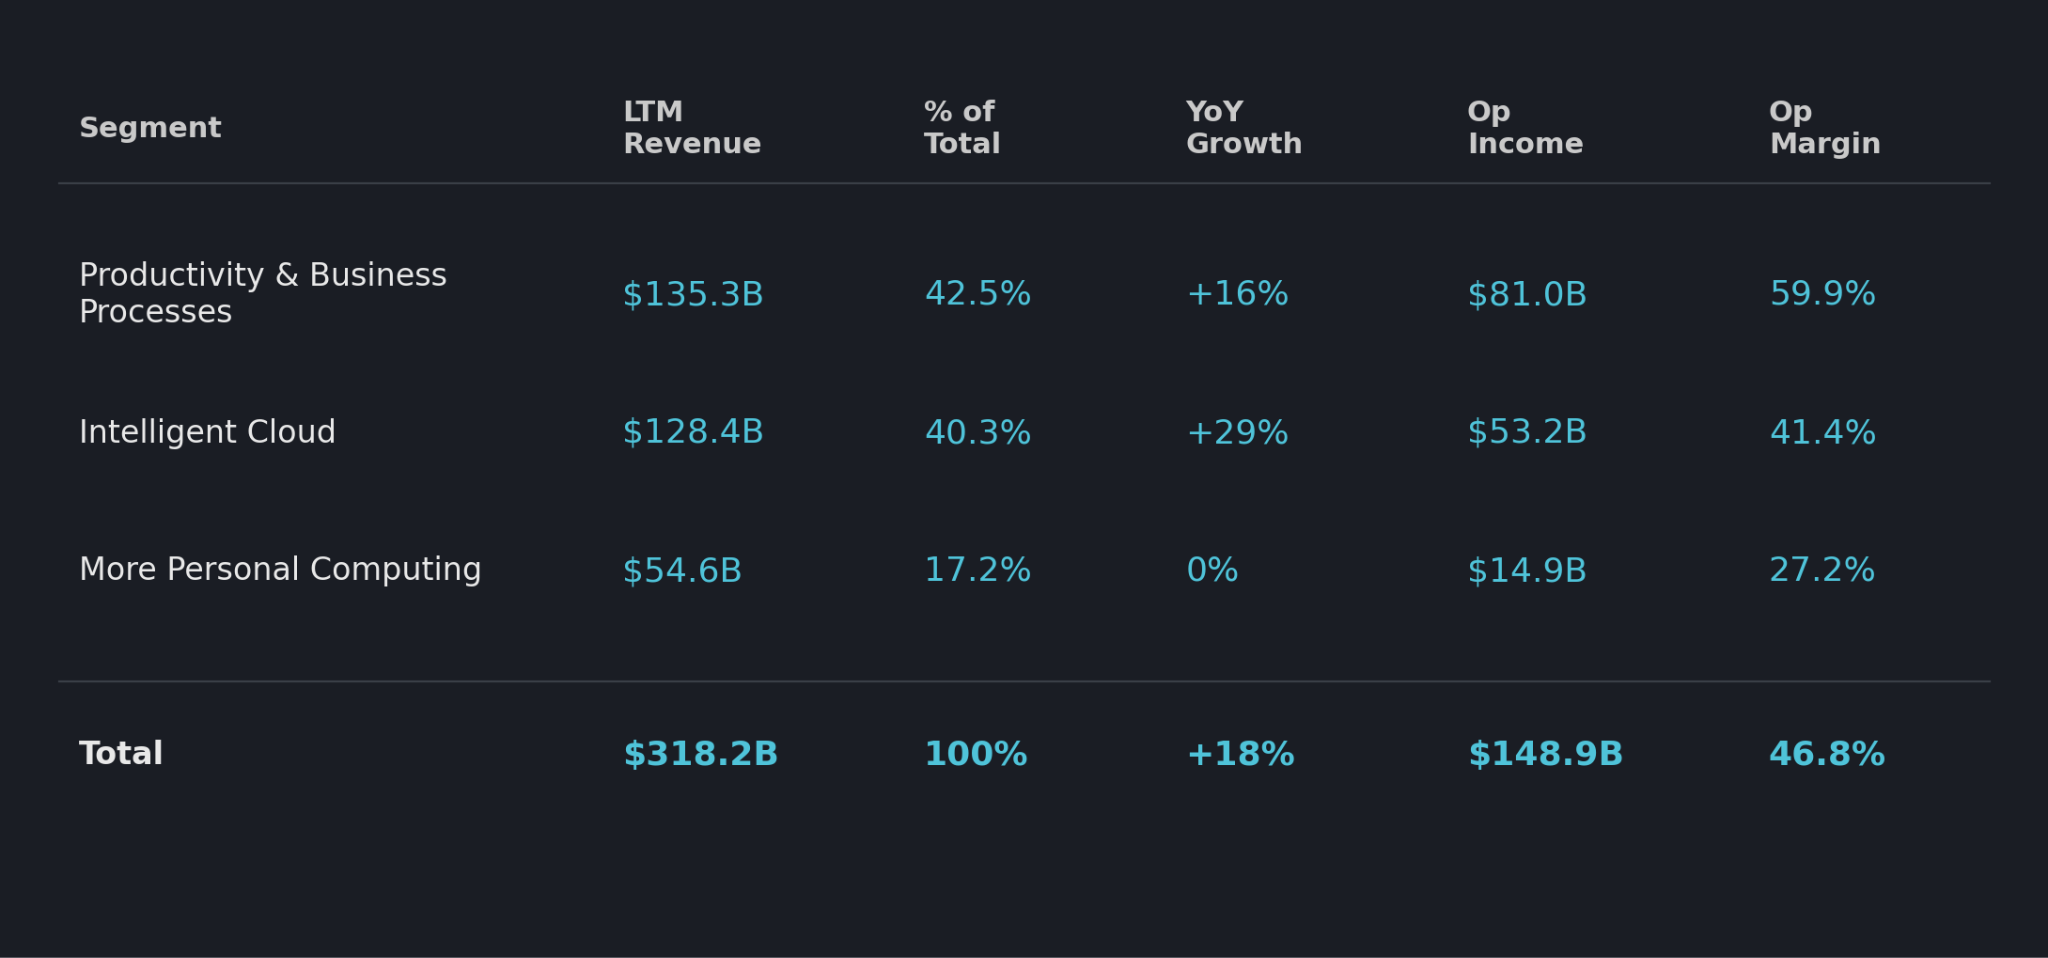
Microsoft is a global technology giant that generates massive enterprise and consumer revenue via cloud computing, software ecosystems, and hardware. The business’ performance is reported through three core segments: Productivity and Business Processes, Intelligent Cloud, and More Personal Computing.
As of FY 2025, this is the revenue mix by segment:
Productivity and Business Processes: $120.8B (42.9% of total)
Intelligent Cloud: $106.3B (37.7%)
More Personal Computing: $54.6B (19.4%)
Geographically, revenue is roughly balanced:
United States: $144.5B (51%)
Rest of the World: $137.2B (49%)
Productivity and Business Processes (PBP)
This segment consists of SaaS, the business model that is the heart of Microsoft and has driven the company’s success. Millions of users built their decade-long professional careers with these products in the center of their workflows. Nonetheless, it’s the segment most exposed to both the AI upsell opportunity and the competitive pressure from AI-native productivity tools.
It includes the Microsoft 365 product suite (core productivity applications like Word, Excel, and PowerPoint, alongside collaboration tools and cloud storage, comprising Teams, OneDrive and SharePoint), LinkedIn, and Dynamics 365 (cloud-based ERP and CRM applications).
PBP is the highest margin segment, achieving an operating margin of 57.8% in FY 2025. In the last 12 months ending March 31, 2026, this segment generated $131.47B in revenue and $67.14B in operating profit.
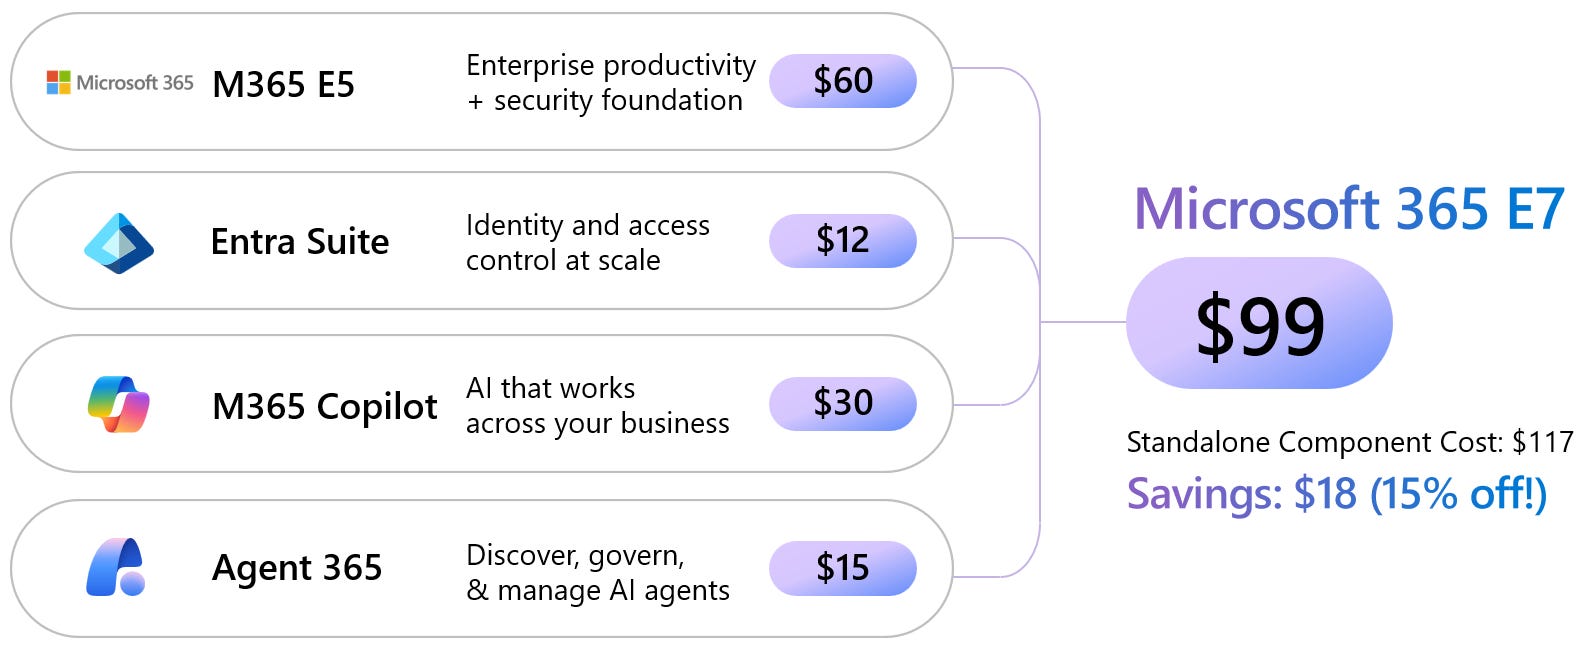
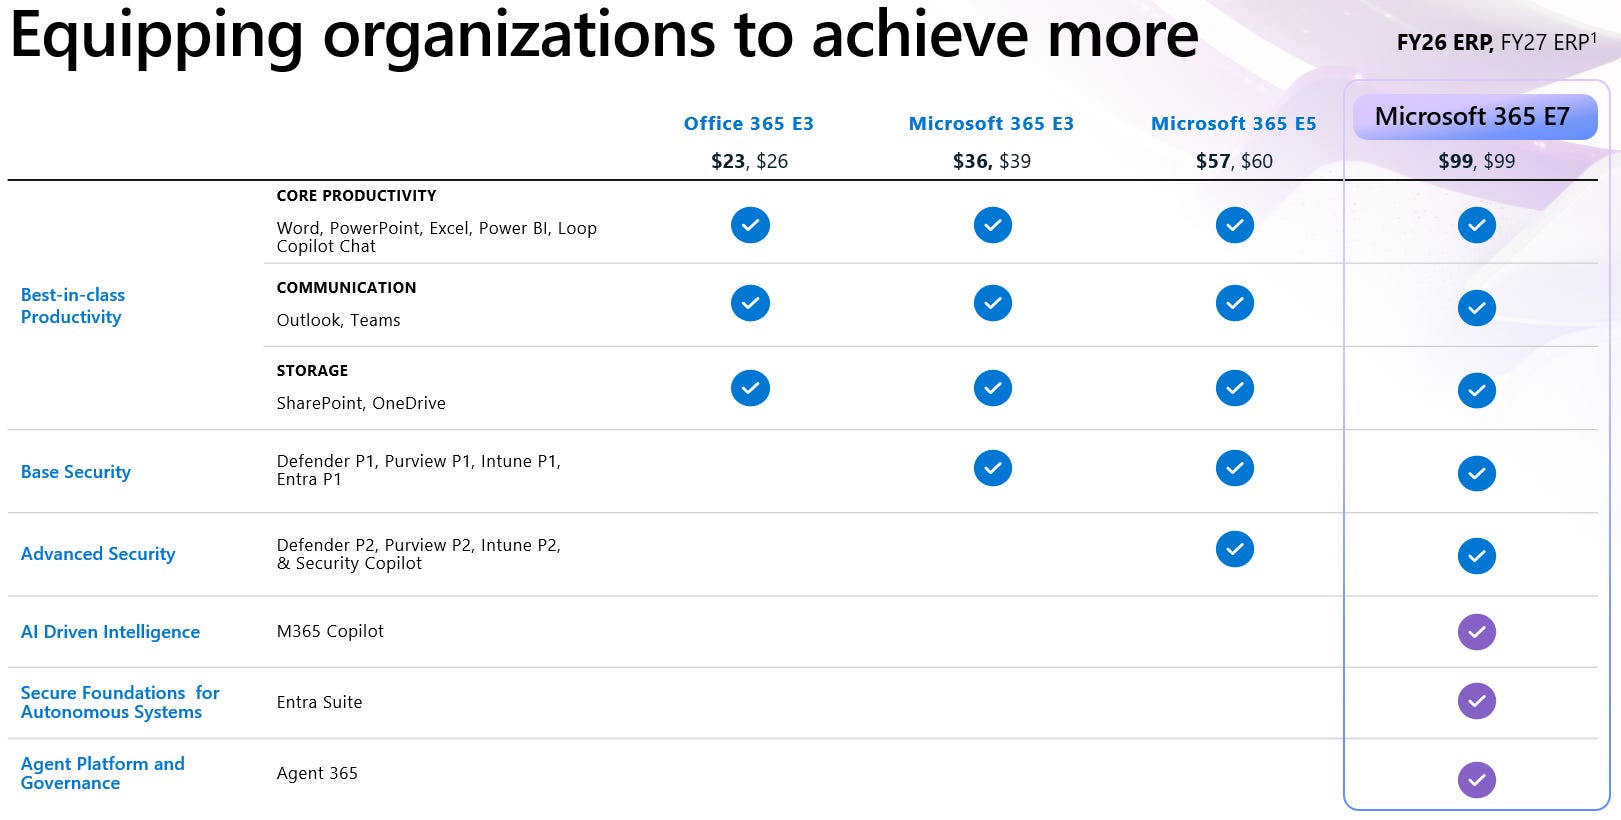
Microsoft 365 commercial paid seats exceed 450 million. It grew 15%, driven by seat growth of 6% and expansion in revenue per user (ARPU) due to the monetization of M365 Copilot, a $30/user/month AI add-on for E3/E5 customers, layered on top of existing paid seats, and the transition from E3 to E5, along with price increases in July 2026. The E5 tier ($60/user/month from $57 pre-increase) includes advanced analytics and more focus on cybersecurity. The E3 is directed to users who need basic features and is priced at $39/user/month, from $36 pre-increase. The M365 E7 is priced at $99/user/month, and focuses on bringing AI and agentic workflows, unifying the M365 E5, M365 Copilot, Agent 365, and Entra Suite.
LinkedIn keeps growing at a solid pace, grew ~9% in FY 2025 driven by all the business lines: Talent Solutions, Marketing Solutions, Premium Subscriptions, Sales Solutions. This company, acquired by Microsoft in 2016, is the global professional network leader with over 1 billion members across 200+ countries, and is the dominant site for career growth, B2B sales, and hiring, although the revenue coming from the hiring side has been normalizing from the post-pandemic spike.
The main reason for the downturn in MSFT stock centers precisely around concerns on this PBP segment. The market no longer takes Microsoft’s capability of retaining enterprise SaaS users for granted, now AI productivity tools compete for that same user base. The company introduced the Copilot add-on, but Claude’s add-ins became way more popular. M365 E7 came to tackle this, but even if the transition from knowledge worker productivity to agentic workflows occurs based on external models, as long as Microsoft remains the go-to in enterprise productivity, it shouldn’t be a problem and might even open a new revenue layer in the future, that way users also have the freedom to choose their desired model inside MSFT’s products.
On the consumer side, Microsoft 365 Consumer products and cloud services reached 89 million subscribers, growing the user base by 8% YoY in FY 2025, with additional revenue-per-user tailwind from the January 2025 price increase, the first since 2013.
Dynamics 365, the ERP and CRM business that focuses on sales, finance, and supply chain management, grew 19% with strength across all workloads, partially offset by continued decline in on-premises Dynamics. This segment is much less prone to disruption than the other M365 productivity tools, companies won’t lose all the data and workforce training on MSFT’s CRMs and ERPs to go for a competitor’s alternative that costs a few bucks less per month.
Intelligent Cloud
The Intelligent Cloud segment is anchored on Azure, GitHub, Windows Server, and SQL Server, but Azure (Microsoft’s cloud division) is the center of attention in the AI thesis, and the source of worries on the increasing levels of CapEx. Over the last 12 months, it generated $128.4B with an overall YoY growth of 28.2%, and an operating margin of 42.8%. Azure maintains a strong cadence, growing its revenue by 40% YoY, although there is a considerable OpenAI 45% weight on the $625B commercial cloud backlog (RPOs, Remaining Performance Obligations), something the market has been discounting, and a risk we’ll evaluate deeper later in the deep dive. Without OpenAI, estimates point to Azure growing 26-28%.
Hyperscalers project a combined $646B to $750B CapEx for 2026, centered on the AI-focused infrastructure buildout. The lack of a clear ROI for shareholders, along with a much lower, and in some cases, negative FCF compared to the previous-buildout enormous amounts of cash these once asset-light companies used to produce, investors have been re-rating the stocks over the past year.
The cost of scaling AI infrastructure ran ahead of the revenue it will eventually produce; cost of revenue grew 36%, well ahead of the 21% revenue growth. This trend will continue until CapEx growth decelerates and AI starts showing a consistent ROI.
More Personal Computing
The consumer-facing segment that includes Windows OEM & devices, Gaming, and Search & News Advertising, generated $54.75B in revenue over the last twelve months, marking a 1% YoY decline. While Search & News Advertising keeps showing strength, maintaining high-single-digit to double-digit growth, Windows OEM remains flat or slightly lower, and the Gaming segment is showing fatigue, due to a 32-33% decline in Xbox hardware console volumes alongside minor drops in Xbox content and services.
As Microsoft transforms from an asset-light software company to a capital-intensive AI infrastructure one, this segment, especially Gaming, will certainly become less relevant for the future of the company, and we’re already seeing divestitures. It’s executing a restructuring of the Xbox division that includes closing five gaming studios and slashing 3,200 jobs (roughly 20% of the Xbox workforce).
Unit economics summary:
4. AI CapEx cycle
The AI infrastructure buildout started in 2023 across most of the hyperscalers. For Microsoft, FY 2023 is roughly the last “normal year” of the pre-AI spending frenzy, FY 2024 is the transition, and FY 2025 is the year where the shape of Property & Equipment, along with Capital Expenditures, became materially different from everything the company has ever reported.
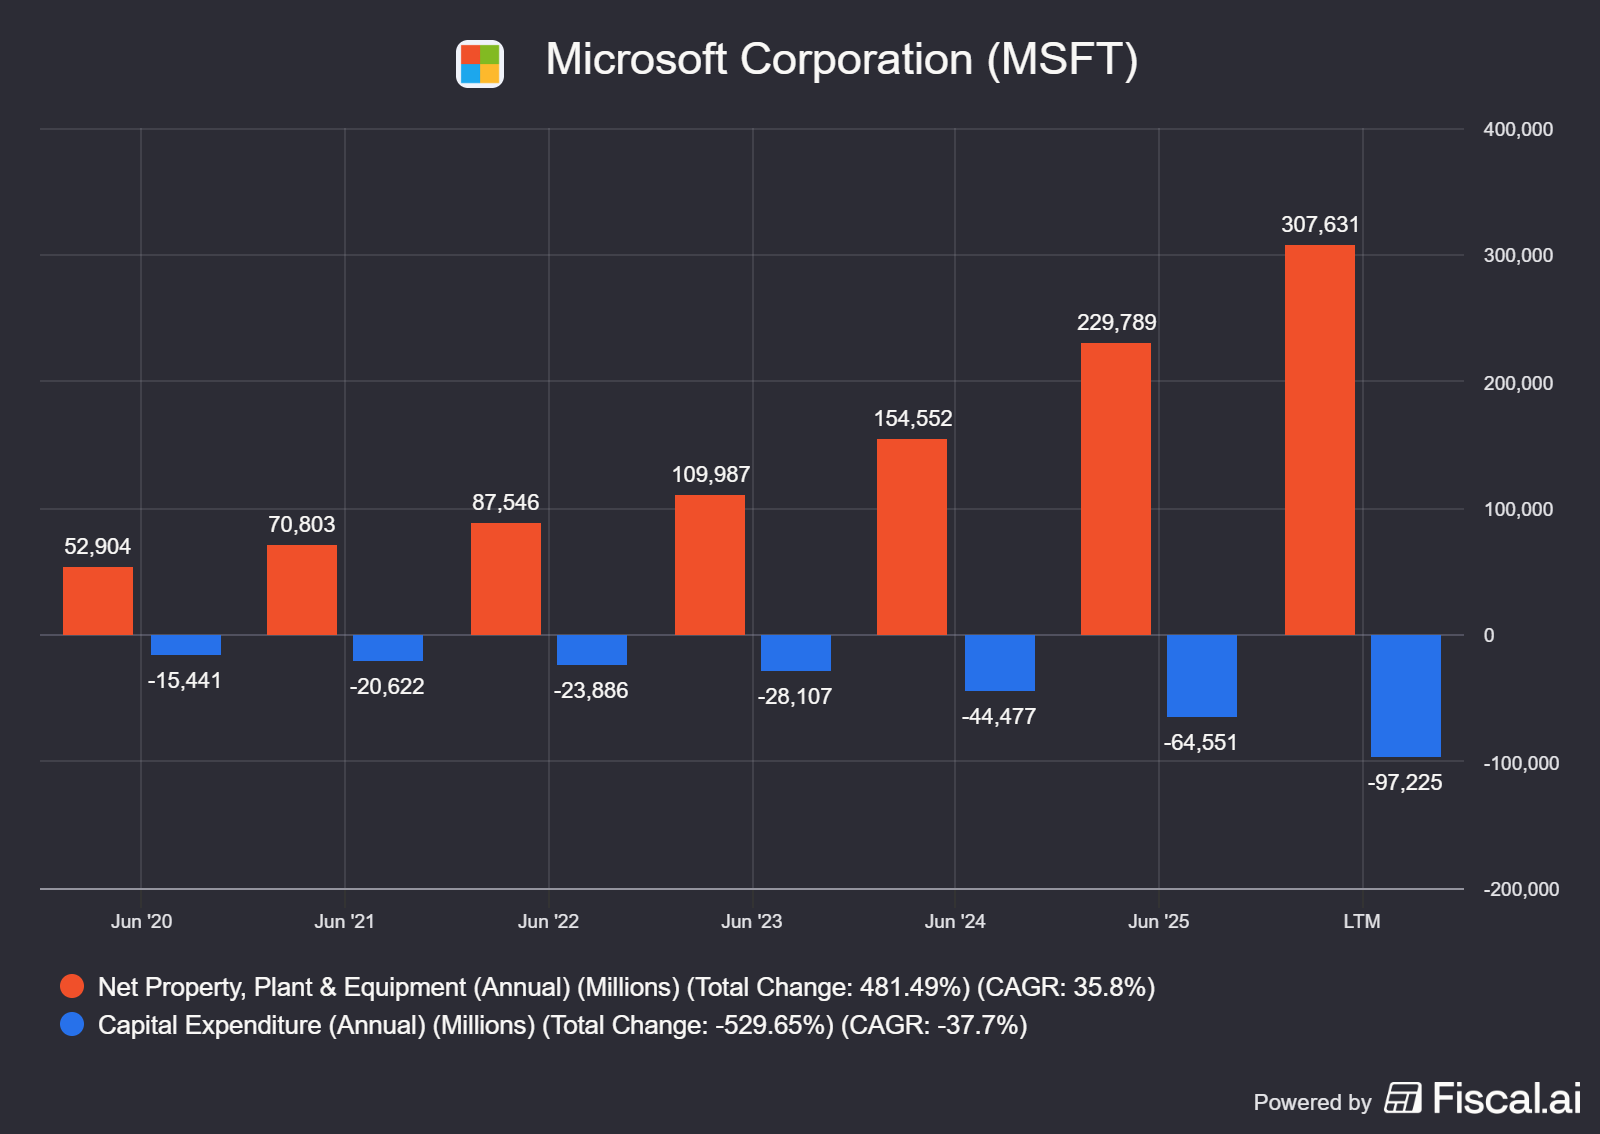
The CapEx increased significantly from 2024 onwards, along with the accumulation of Property, Plant & Equipment on the balance sheet. Not only that, it became the largest asset in the balance sheet.
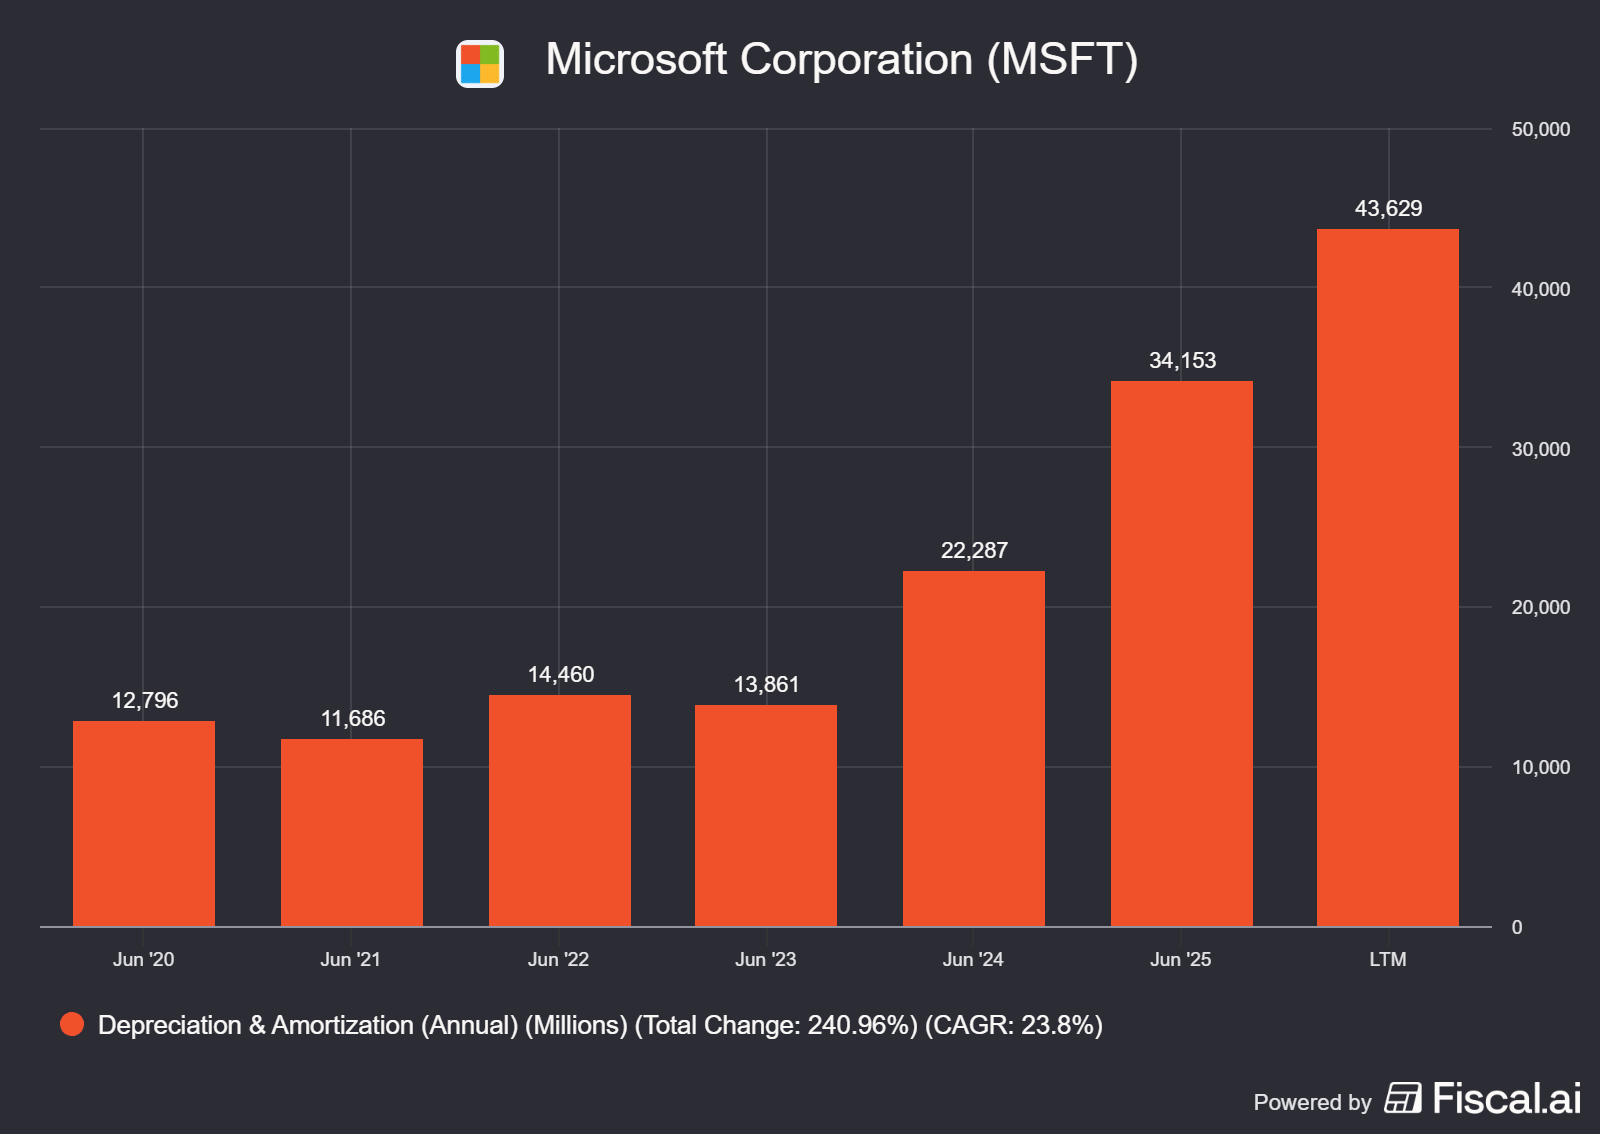
Depreciation & Amortization is up 214% since 2023. That’s the same year Microsoft extended the useful life of server and network equipment from 4 to 6 years. The current 10-K disclosure widened the range for computer equipment to “two to six years”. The two-year floor is related to the AI silicon (H100s, GB200s), which is depreciating faster than legacy equipment. If this tightens further as GPU generations turn over more quickly, D&A grows faster than the CapEx schedule implies.
Management’s disclosure has moved from “roughly half short-lived, half long-lived” during FY 2025 to “roughly two-thirds short-lived, one-third long-lived” in Q3 FY 2026. Hood was explicit on the Q3 call: “This quarter, roughly two-thirds of our CapEx was for short-lived assets, primarily GPUs and CPUs. The remaining spend was for long-lived assets that will support monetization over the next 15 years and beyond.”
Applying management’s disclosure to the ~$105B LTM CapEX:
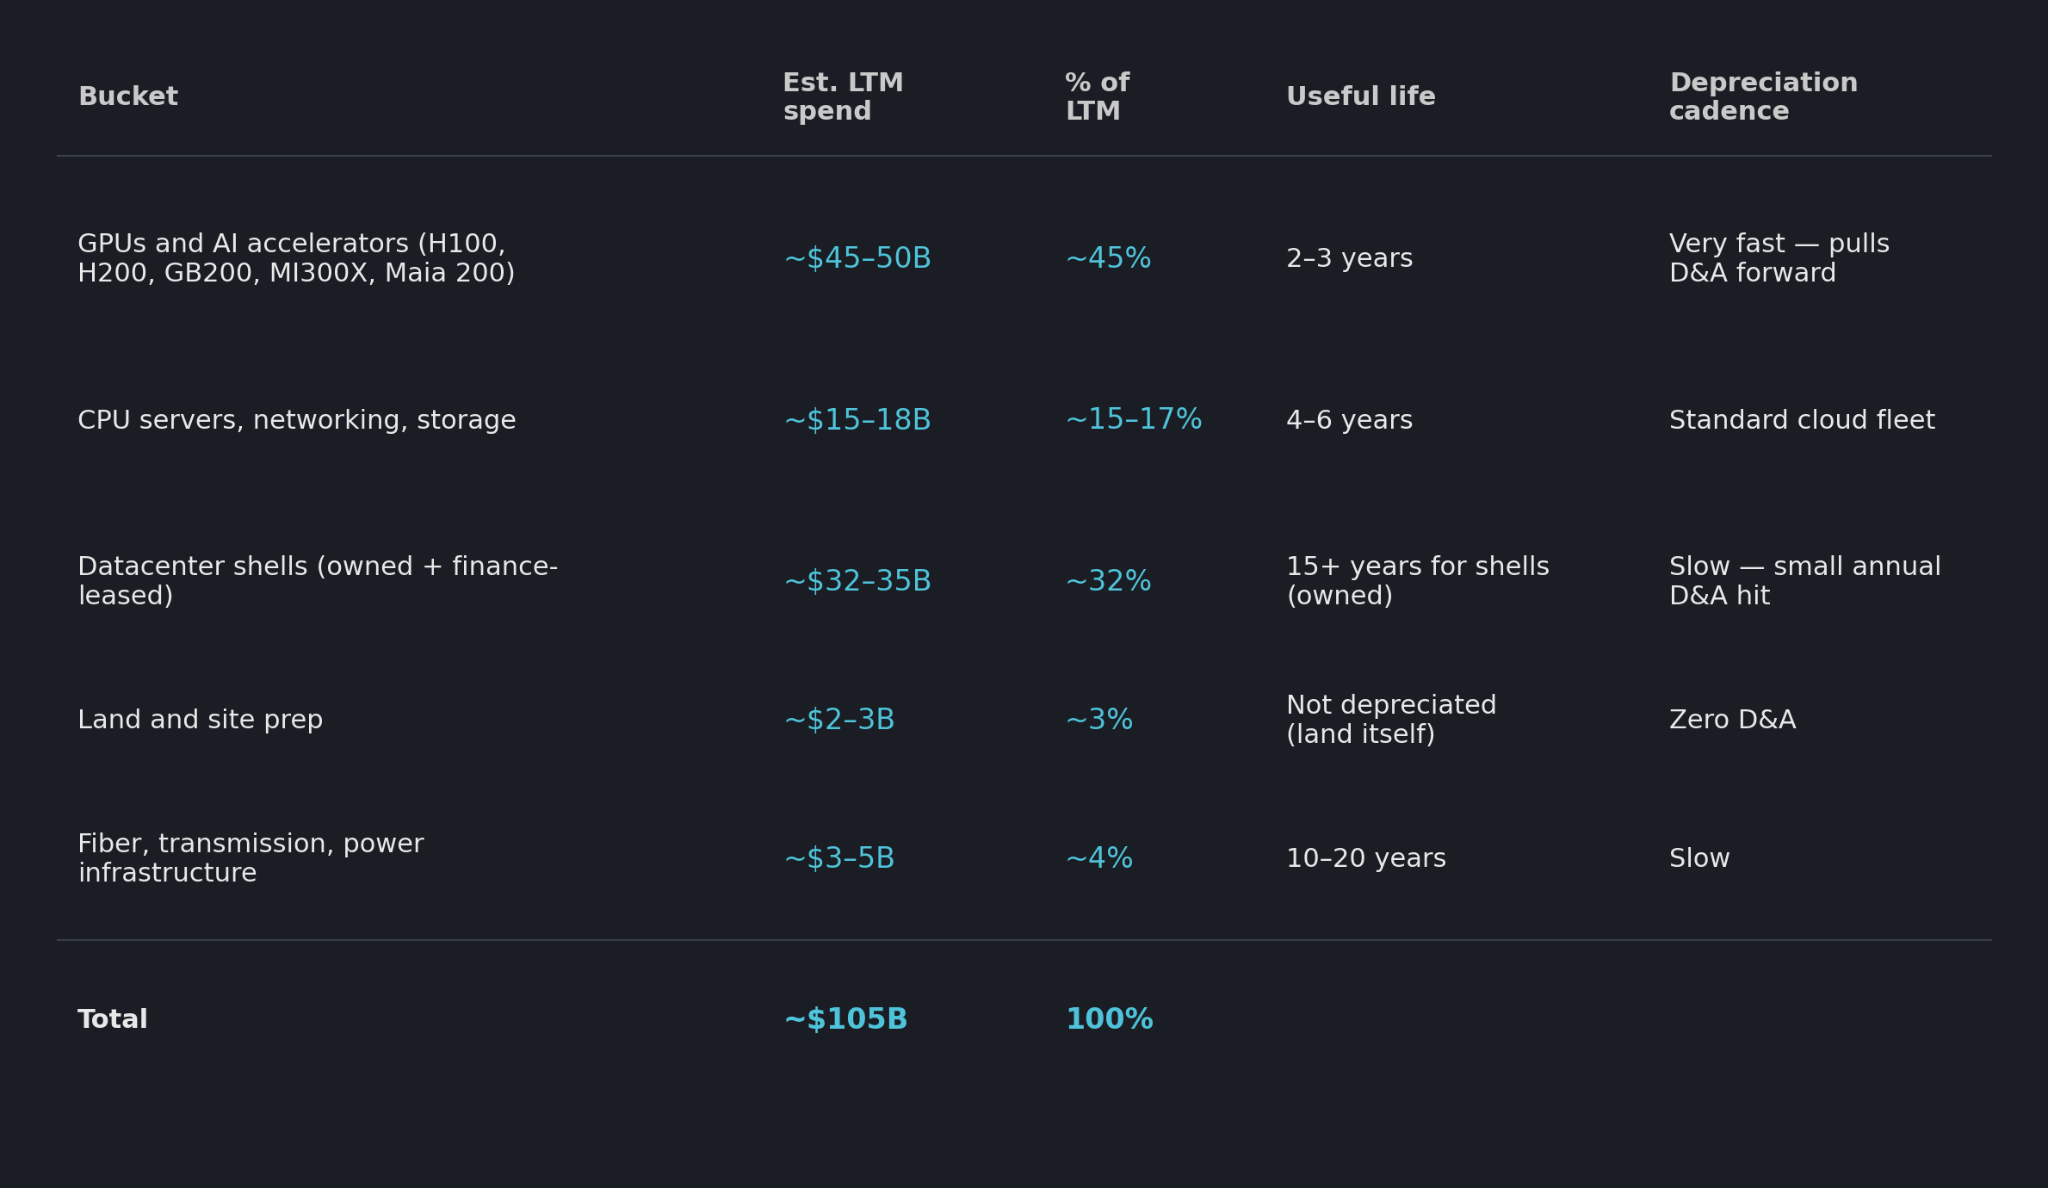
From this table, we can estimate how much of the current CapEx will occur again in the 2-6 years time window, updated to the inflation of each component at the respective time.
5. OpenAI relationship
The relationship between Microsoft and OpenAI started in 2019 with an initial ~$1B investment, structured through an equity method investment in OpenAI Global, LLC. In this initial agreement, Azure became the exclusive OpenAI’s cloud provider, gave Microsoft exclusive rights to embed their AI models into its products (Copilot, Azure OpenAI Service), bidirectional revenue share between both companies, and an AGI clause where Microsoft’s IP rights would be terminated once OpenAI achieved it.
In late October 2025, due to OpenAI’s for-profit/non-profit issues, the company converted from a capped-profit LLC (hybrid corporate model originally pioneered by OpenAI in 2019 to limit investor financial returns while still attracting venture capital) to a Public Benefit Corporation (OpenAI Group PBC), with a newly-named OpenAI Foundation nonprofit holding a ~26% controlling equity stake formalized on an as-converted diluted basis, valued at $135B.
Also in October 2025, OpenAI made an incremental $250B commitment to Azure, the driver of the RPO explosion to $625B, and IP rights were extended through 2032, subject to AGI-related matters. Six months later, the main terms changed:
OpenAI no longer runs exclusively on Azure, now it can serve products across any cloud. Azure remains the “primary partner,” ships first unless Microsoft can’t or chooses not to support.
IP license became non-exclusive through 2032.
Microsoft revenue share to OpenAI eliminated.
OpenAI revenue share to Microsoft continues through 2030, is capped in aggregate, and no longer tied to AGI milestones.
With roughly 45% of the $625B RPO tied to the OpenAI commitment, there is a real concentration risk that deserves to be reflected on the stock price. Excluding OpenAI, Azure would be growing ~26%, in line with AWS and behind GCP. Microsoft has the contracted revenue required to fill the capacity it’s building, although if the use of OpenAI’s models decreases and its economics deteriorate, MSFT loses half of Azure’s growth and 45% of the backlog come into question simultaneously.
OpenAI continues to lead the AI chatbot market, but enterprise LLM spending has been going for competitors. In 2024, the company owned over 80% of the conversational AI market, but competition ended its monopoly, and the market share dropped to ~45%, still leading Google (Gemini), which sits at 25-28%. On the corporate B2B side, Anthropic is the undisputed leader with 40% of the market share of enterprise LLM spend. OpenAI still accounts for 27%, but it’s a meaningful drop from the 50% market share it held in 2023. However, 92% of Fortune 500 companies deploy ChatGPT in some capacity.
On the valuation side, holding a ~27% equity stake in OpenAI, a company that raised capital at a $730B valuation in February 2026 and $852B in March 2026, reportedly filing for IPO with a target trillion-dollar valuation by Q4 2026, means that Microsoft’s stake is worth $200-$280B. This is the highest-return investment in the company’s history, a 15-20x return on the initial $13B commitment.
6. Usage-based monetization transition
For some time, Microsoft refused to disclose Copilot seat counts, a situation that reversed in Q2 FY26 earnings when the company announced 15 million paid Copilot seats. Three months later, on the Q3 FY26 call, Nadella disclosed the number had crossed 20 million paid seats, up 250% YoY, 5 million net adds in a single quarter.
On July 1, 2026, Microsoft completed the transition to usage-based, credit-metered billing across Copilot Studio, Azure AI Foundry, and Copilot Cowork. Pricing got restructured, and now it’s divided between per-seat and variable copilot credits.
Per-seat is the entry point, a fixed base license where the user pays $21-32/user/month depending on tier.
Variable Copilot Credits cost roughly $0.01/credit, 1 credit for a classic answer, up to 100+ for premium AI tools.
The prior per-seat model caps revenue growth at seat growth. The seat + consumption model captures seat count, tier upsells (E3 → E5 → E7), and intensity of use per seat. Revenue per customer goes up as long as usage grows faster than seat count.
The current installed base is 450 million paid M365 seats as of Q3 FY26. Paid Copilot seats sit at ~20M, a conversion rate of 4.4%, which means that roughly 95% of the commercial M365 user base is not yet being monetized with a paid Copilot seat. The transition to credit-metered billing is still only across Copilot Studio, Azure AI Foundry, and Copilot Cowork, not the whole M365 product ecosystem, meaning that ~95% hasn’t touched the consumption-based upsell yet. When we run the numbers, an untapped pool of ~430 million M365 commercial seats at $30/seat/month = $360/seat/year would imply an additional ~$155B in annual Copilot revenue on top of current M365 revenue. Applying a realistic 40-60% enterprise discounting and assuming Microsoft never gets past 40%, it leads to ~$25-40B of incremental revenue from Copilot seats alone, with the consumption upsell as additive revenue on top.
This justifies the CapEx cycle, the conversion of a fraction of the 430M untapped user base with consumption-based revenue on top provides a ROI to the mammoth amounts of money being invested in infrastructure now.
7. Moat & Competitive Position by Segment
Microsoft possesses a wide economic moat in enterprise software. Millions of people spent their entire professional careers in the Office stack. In the enterprise software market, MSFT owns a leading share of 35%, with IBM far behind at 8.5%. The moat is driven by network effects, high switching costs, and cloud economies of scale. No other company is better positioned to win the enterprise segment in the AI age, Microsoft already owns unmatched distribution to launch AI products inside M365, and can integrate the agentic workflows in its ecosystem.
Enterprise customers face operational retraining, security, costs, and integration challenges if they look to replace Microsoft’s set of tools, along with the standardized corporate file formats and collaboration platforms that teams have relied on since the pandemic.
The biggest risk is that Microsoft’s AI integrations generate a smaller ROI for clients’ workflow efficiency than competitors’ products, leading to churn and lower pricing power.
For the moat to remain strong, the company doesn’t need to always build the models it incorporates inside the ecosystem, it can license alternative ones. Microsoft wins either way, the model developers don’t have comparable enterprise and consumer distribution capabilities, nor the decades of trust. It can serve the whole stack, from Copilot to Cloud to Software to Custom Silicon to the most recent agentic platforms.
Demand for the recent AI-related products has proven to be strong, Azure grew 40% YoY in the last quarter, achieving rapid scale led by a $37B AI annual revenue run rate, up 123% YoY. Copilot already crossed 20 million paid users by the spring of this year, together with a 90% adoption across top-tier, Fortune 500 corporate clients.
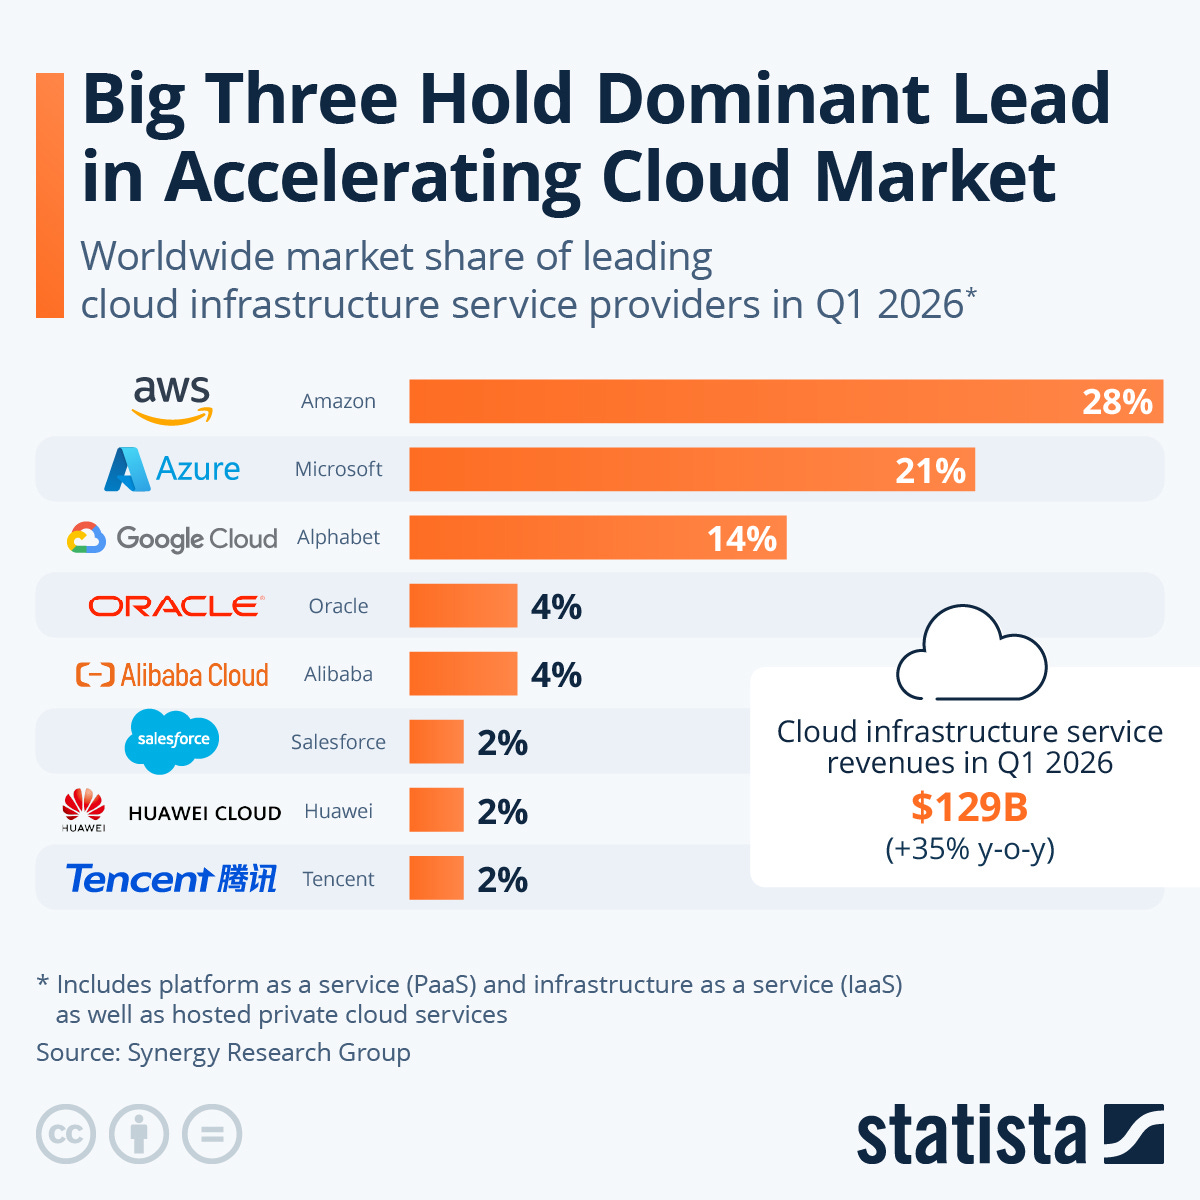
On the Cloud market, the big three (Amazon, Microsoft and Google) account for roughly 63% of total enterprise spend, with AWS leading at 28%, Azure at 21%, and Google Cloud at 14%. Each of the three dominates in its own space, Amazon focuses on infrastructure, Microsoft in integration with enterprise software, and Google on data analytics and AI capabilities.
8. Financial Analysis
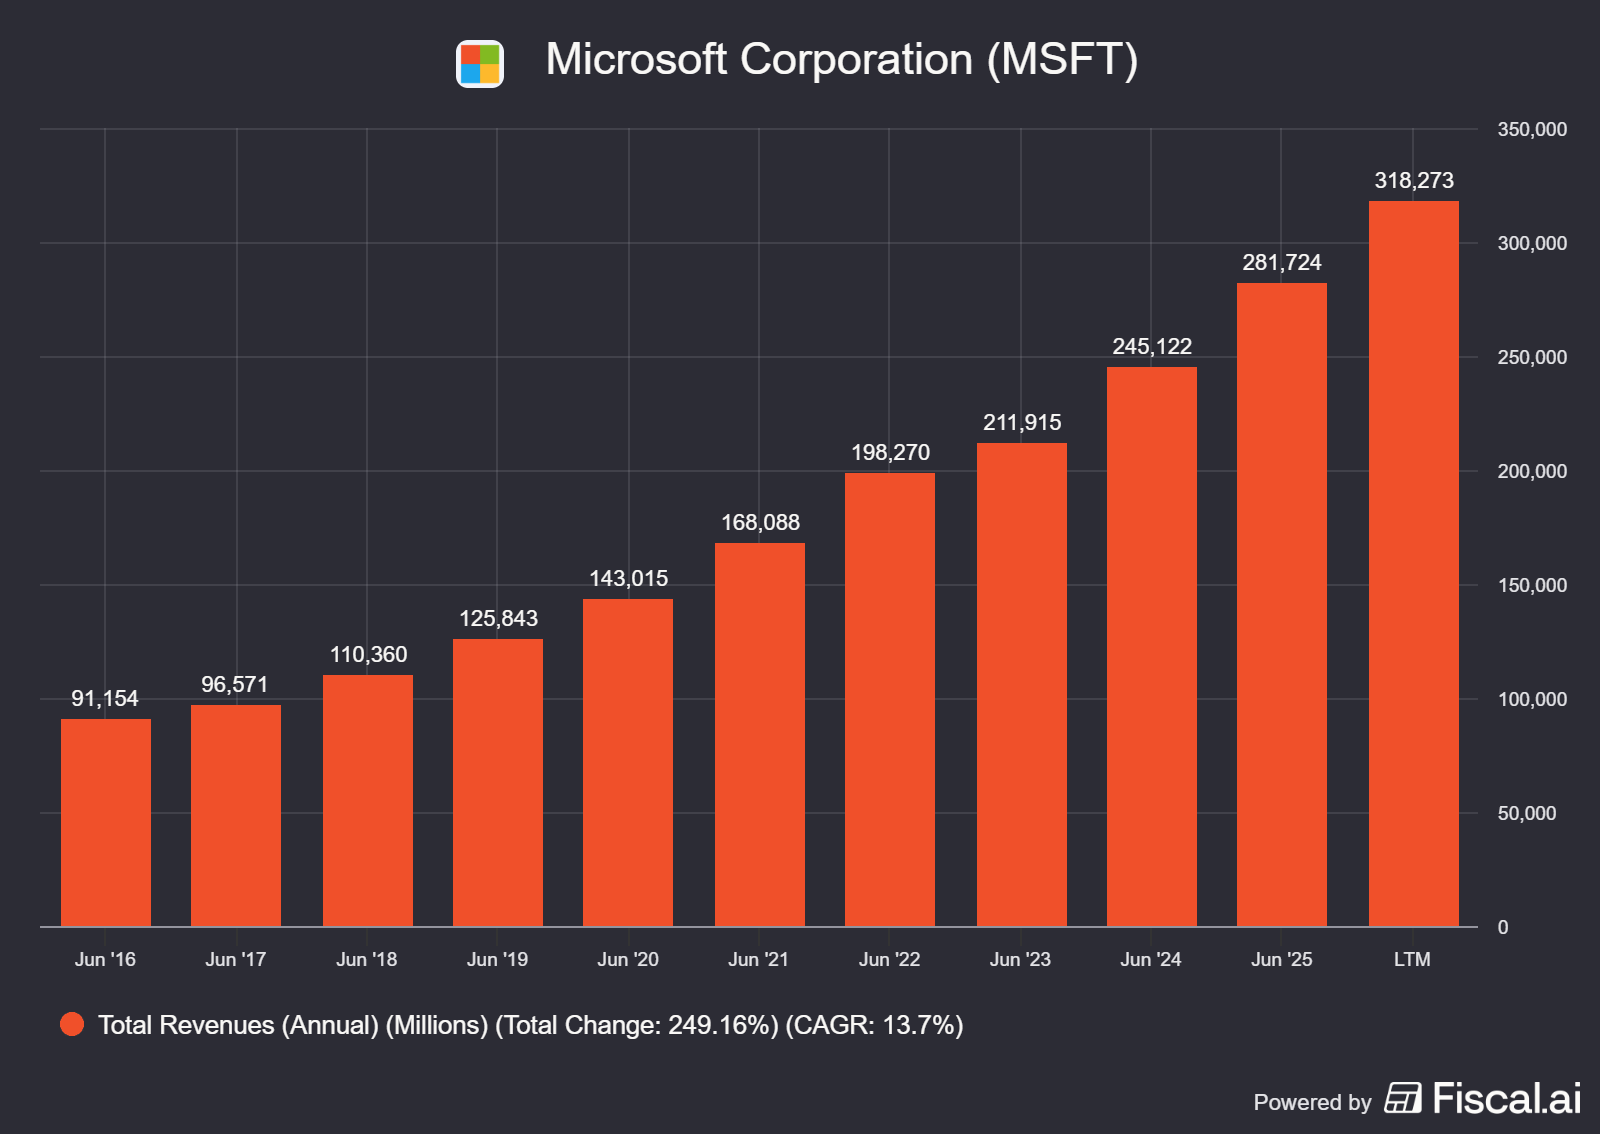
Revenue growth > 10% CAGR ✅ 10-Year CAGR: 13.67%
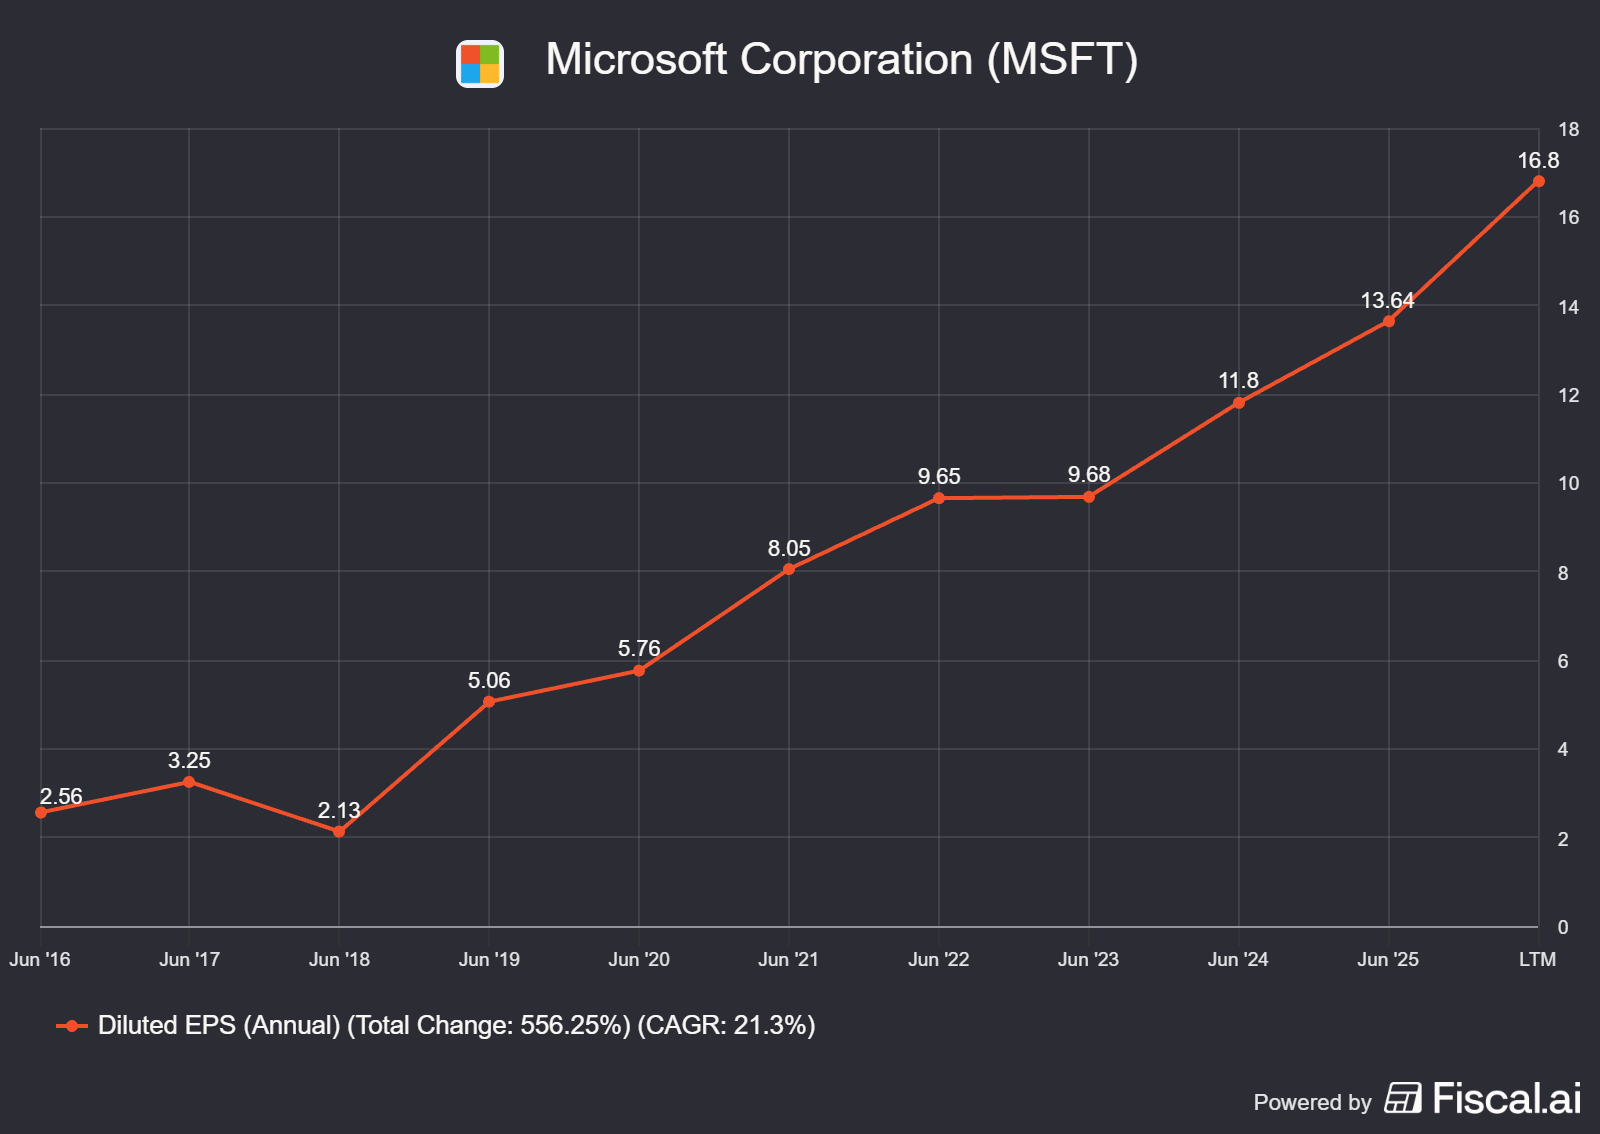
Earnings growth ≥ revenue growth ✅ EPS 10-Year CAGR: 21.27%
ROIC ≥ 15% ✅ LTM ROIC: 22.9%
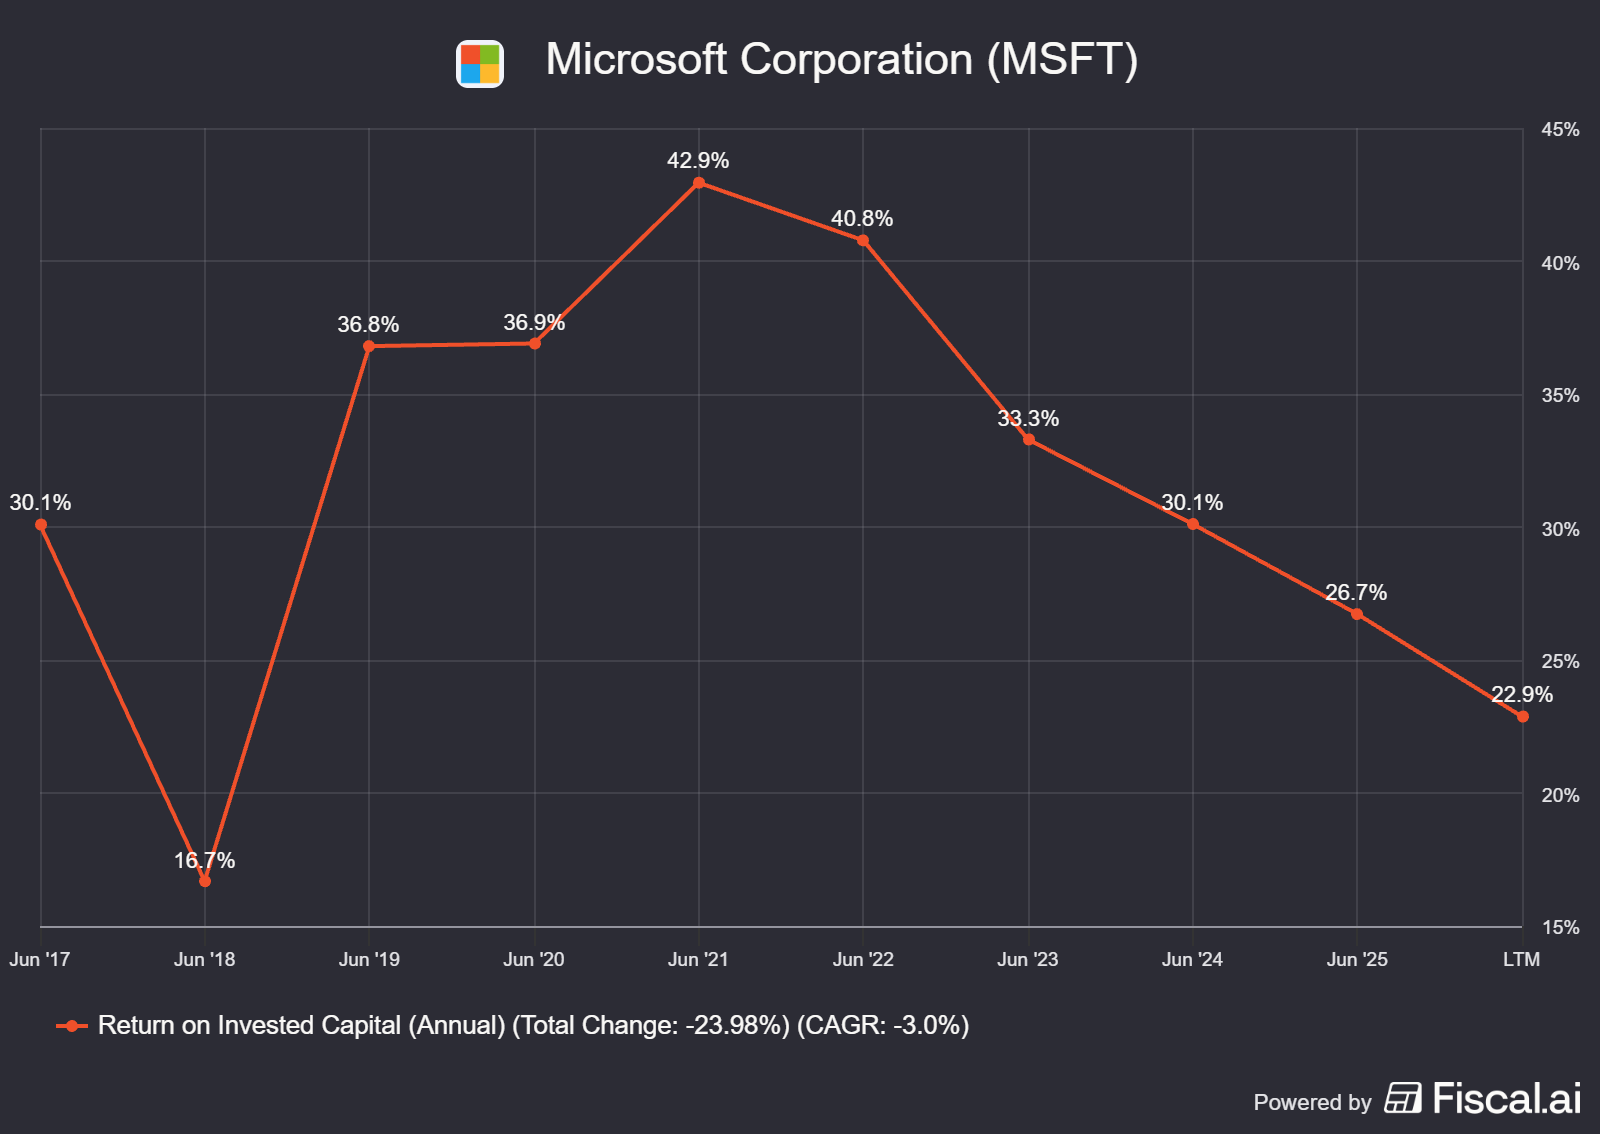
ROIC has been down since 2022 as the denominator (invested capital) swelled rapidly as billions in capital and debt were pumped into fixed assets before realizing net operating profit after tax (NOPAT).
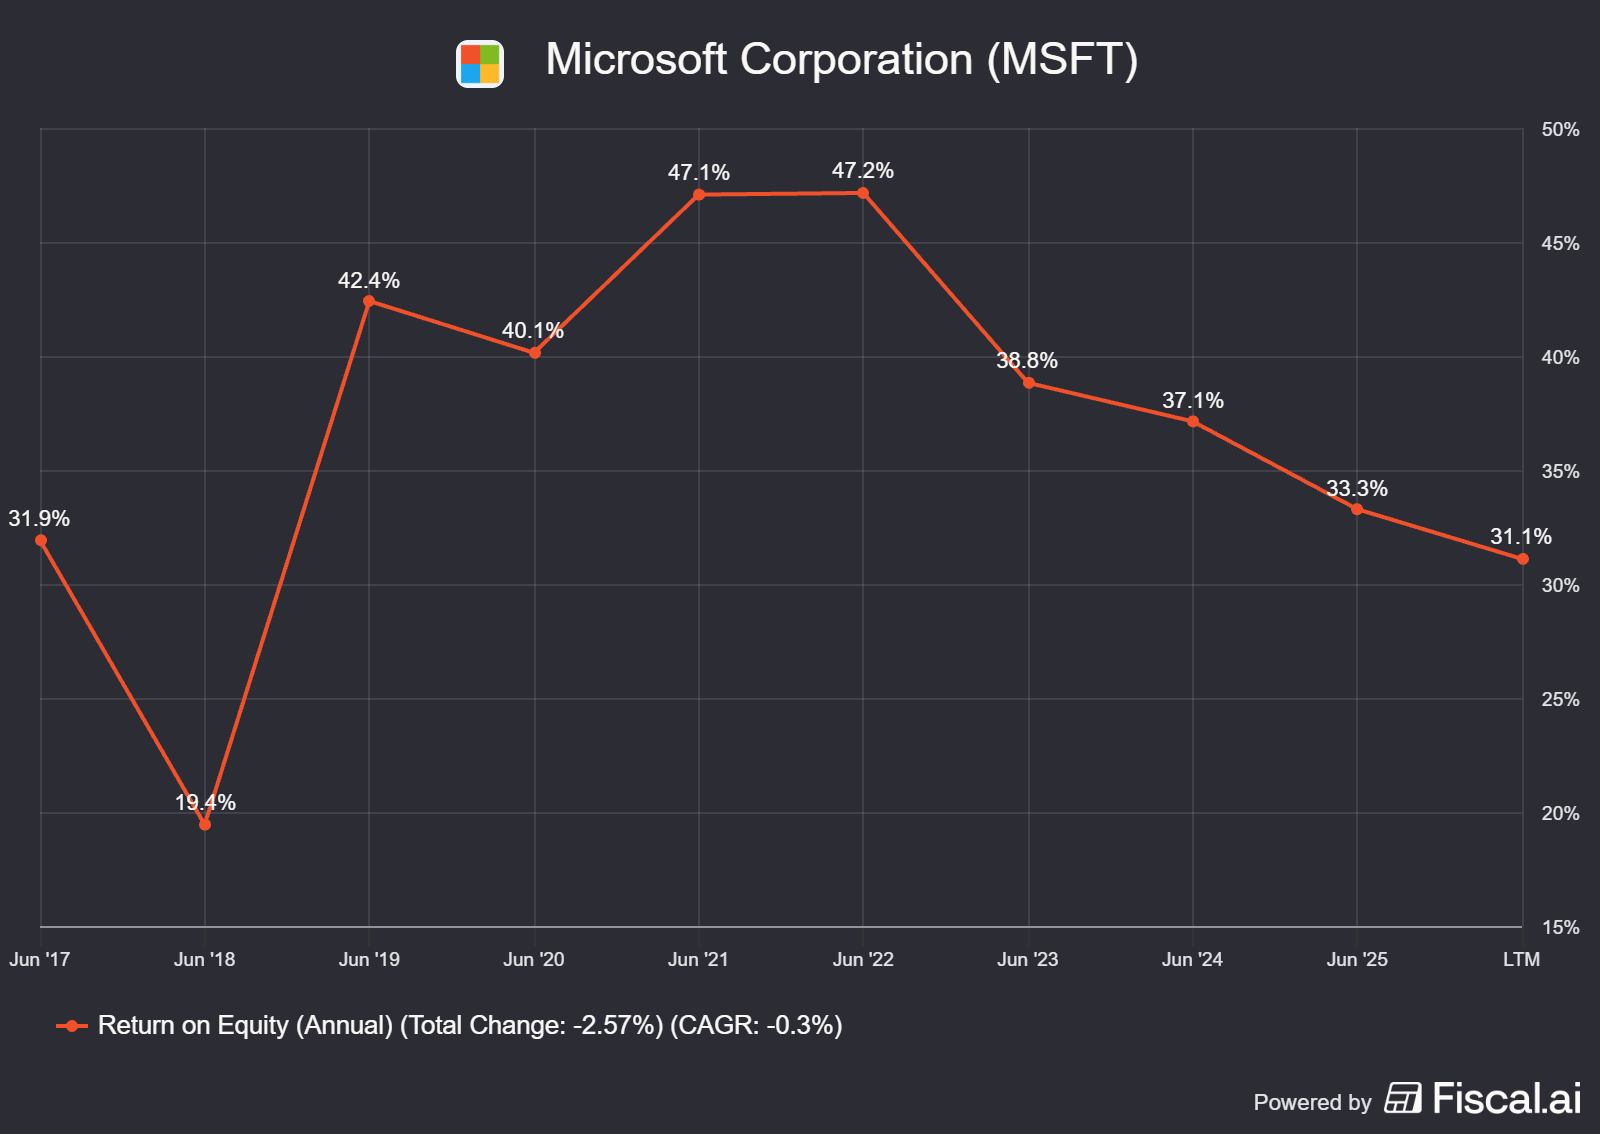
ROE ≥ 15% ✅ LTM ROE: 31.1%
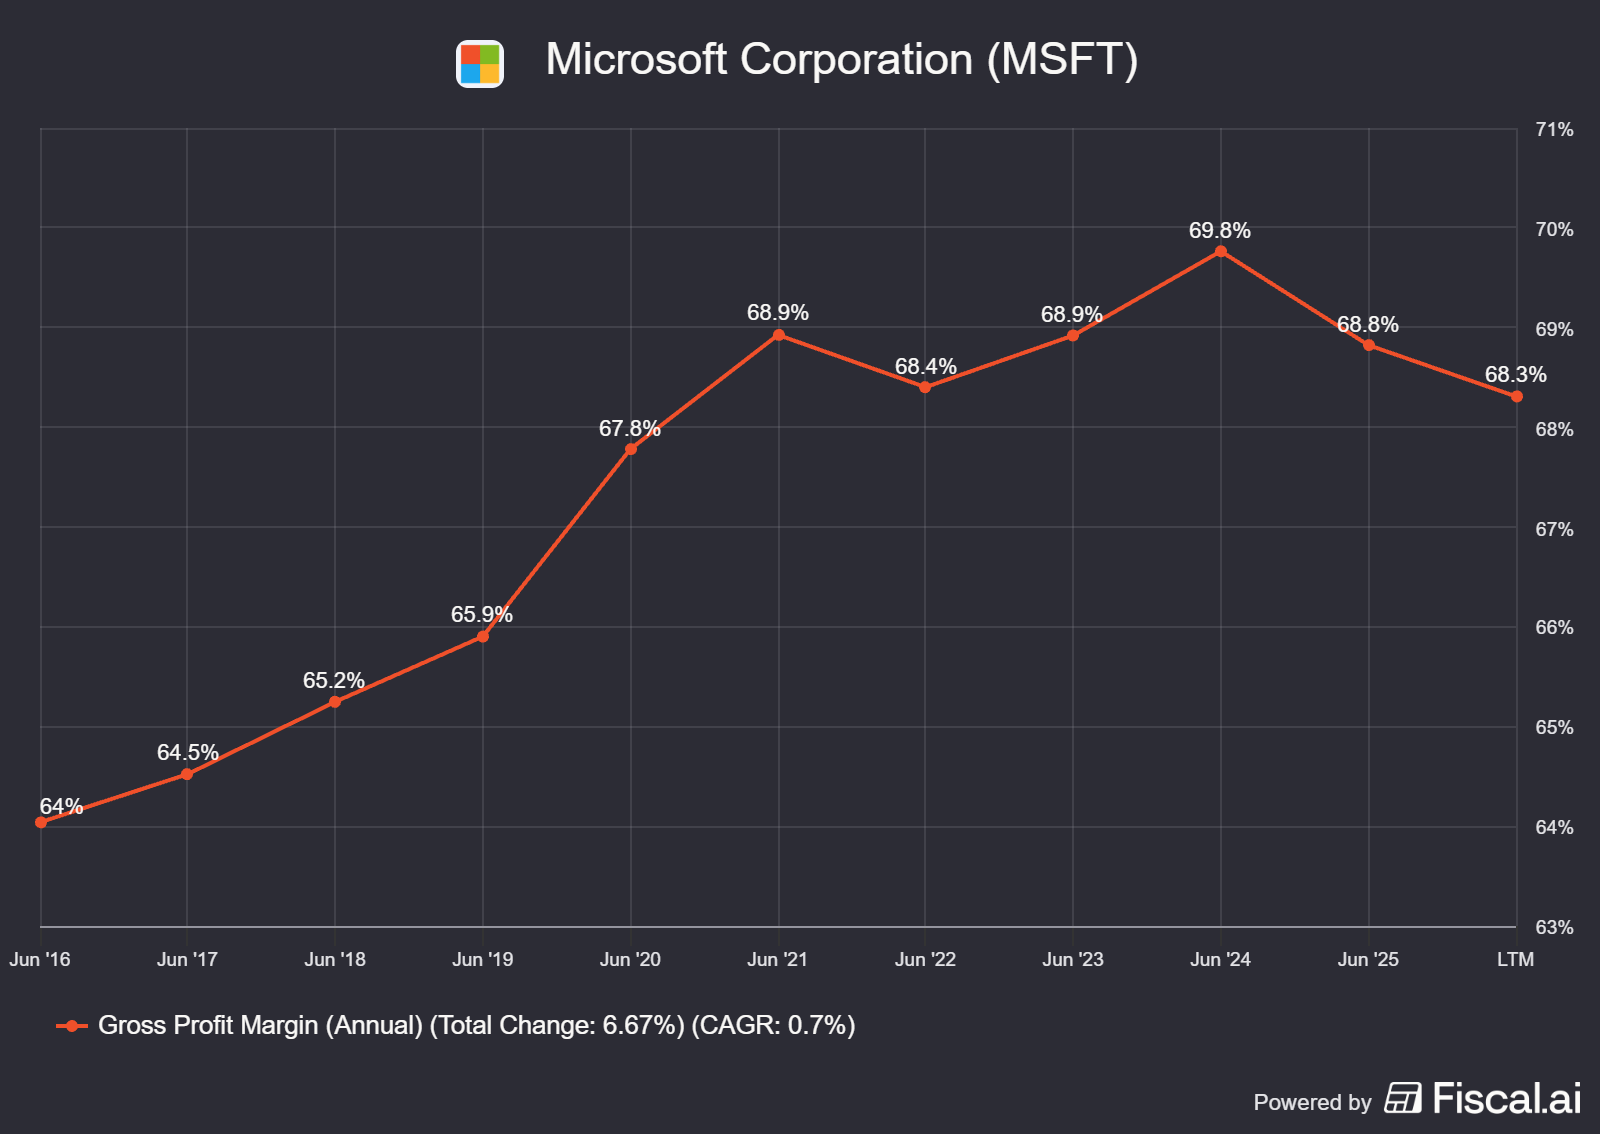
Gross Margin stable ✅ LTM Gross Margin: 68.3%
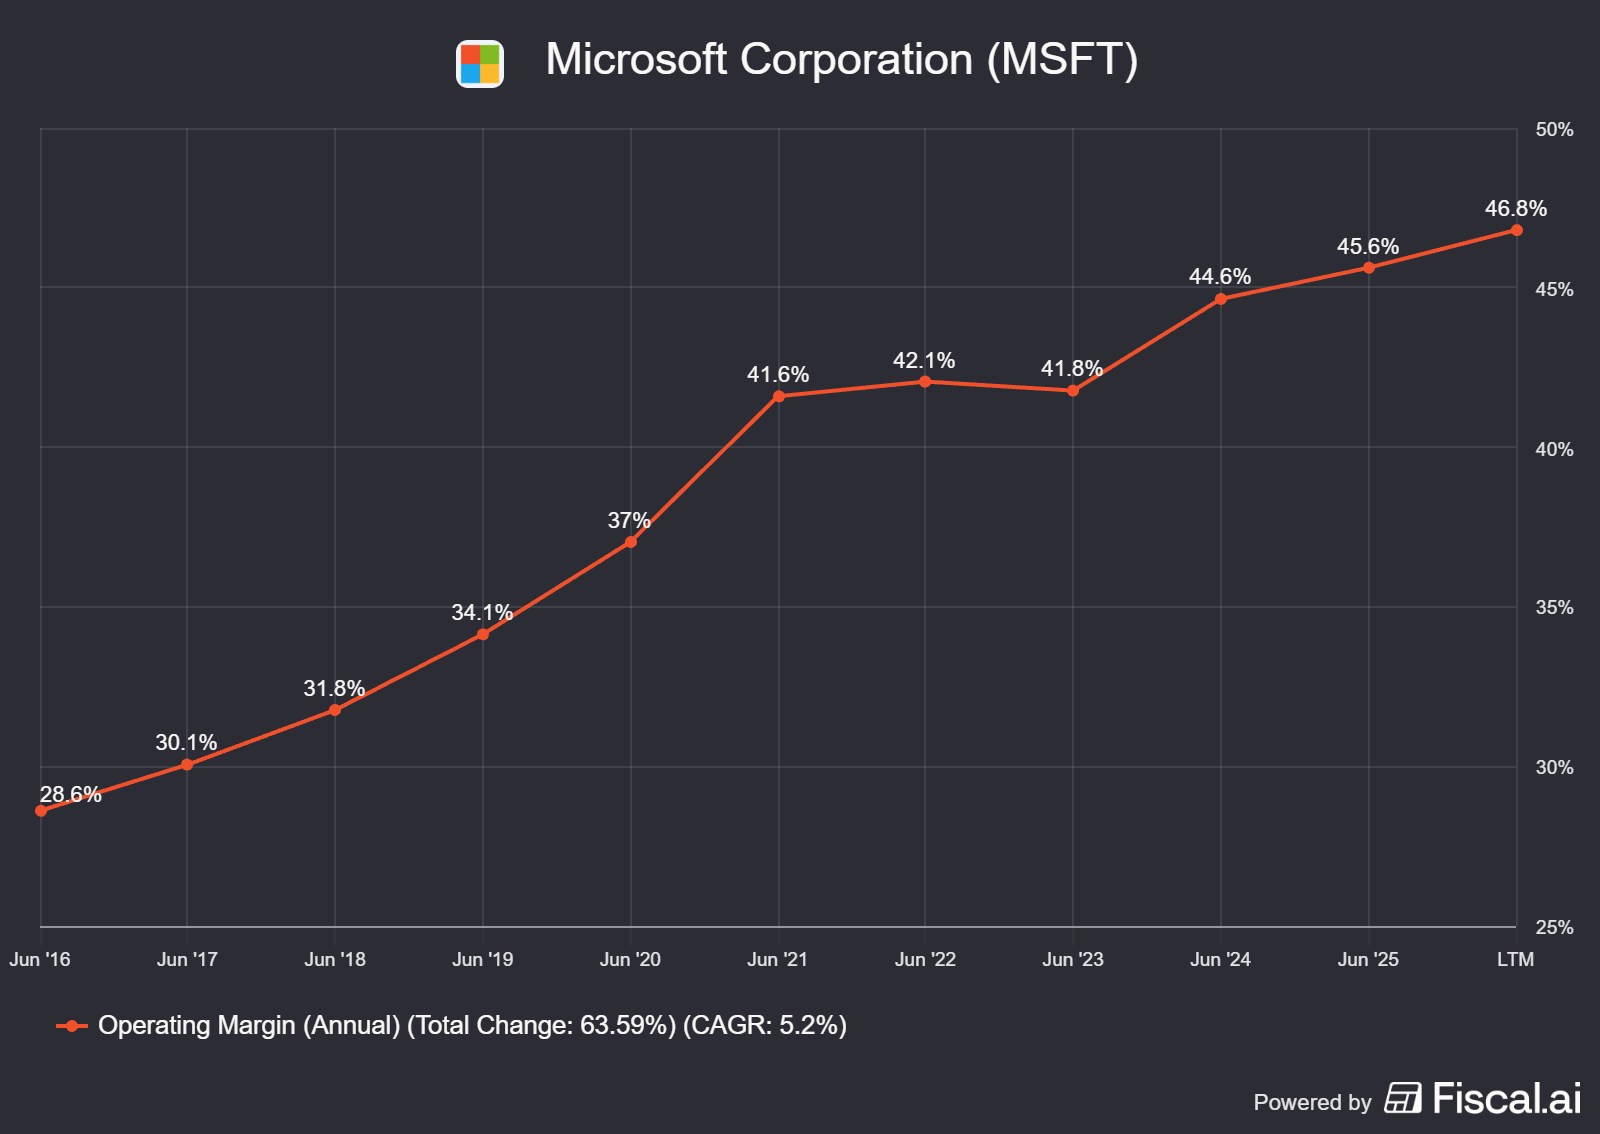
Operating Margin rising ✅ LTM Operating Margin: 46.8%
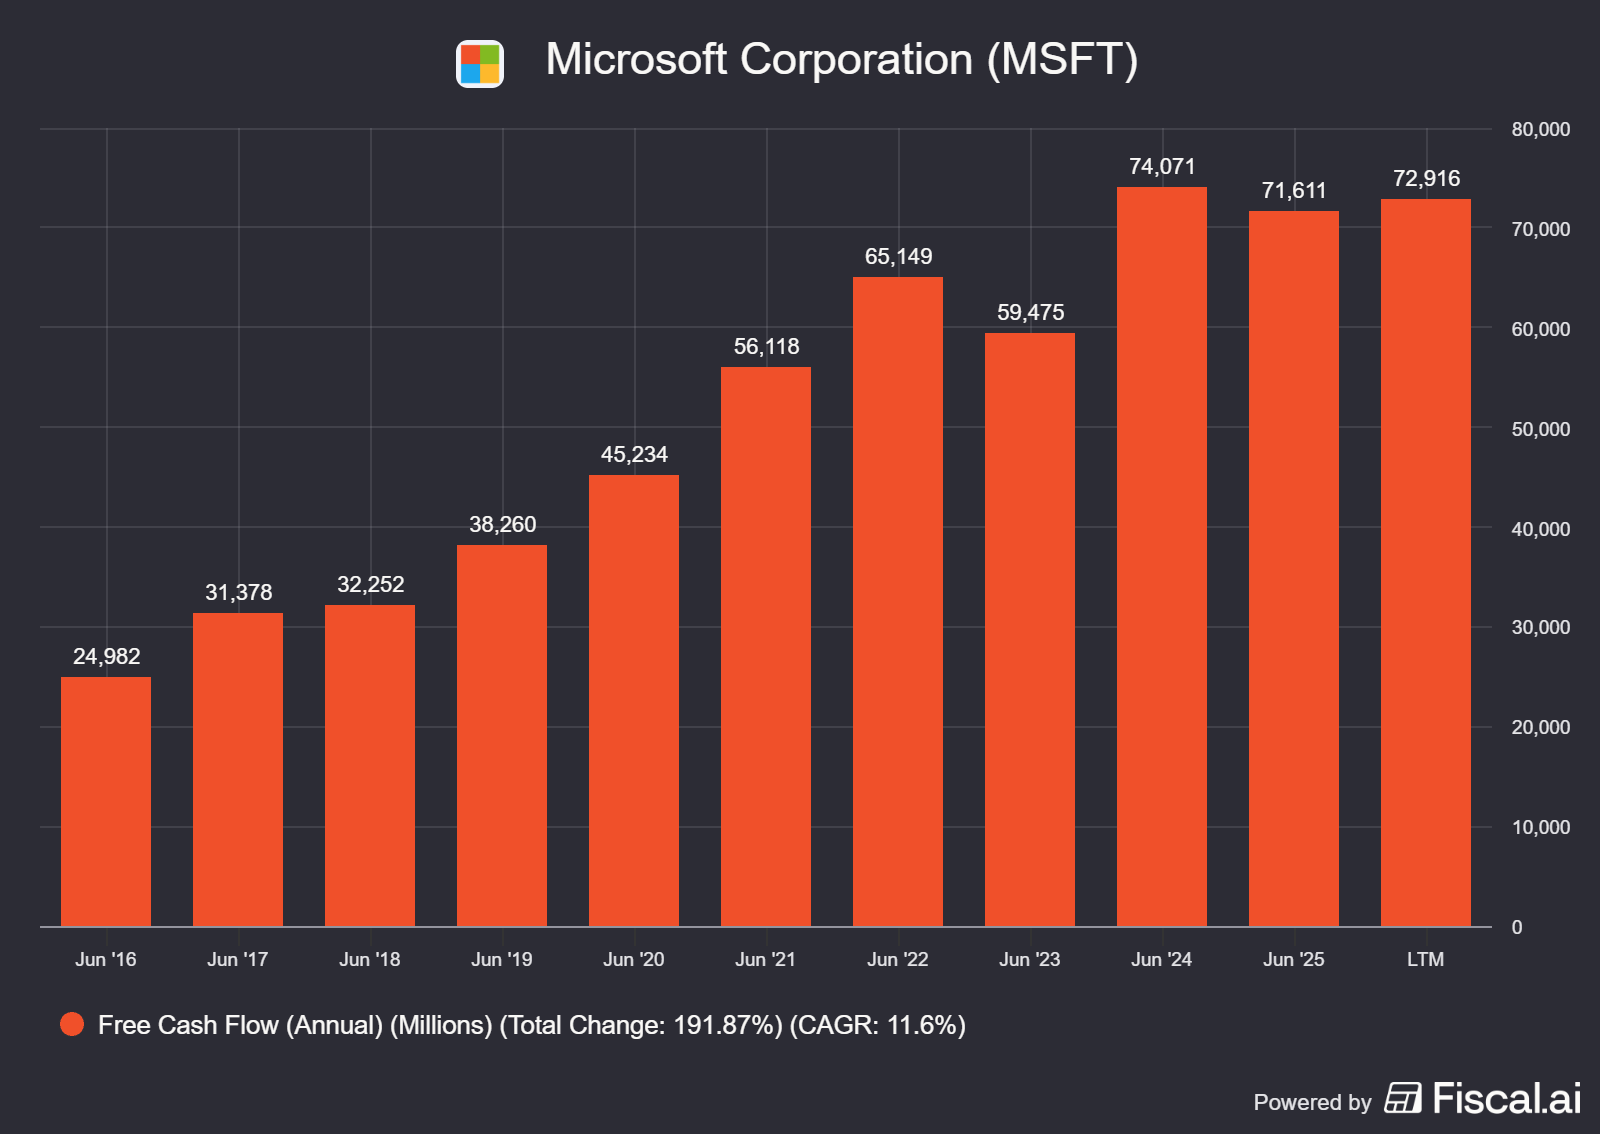
FCF positive & growing over time ✅ FCF 10-Year CAGR: 11.6%
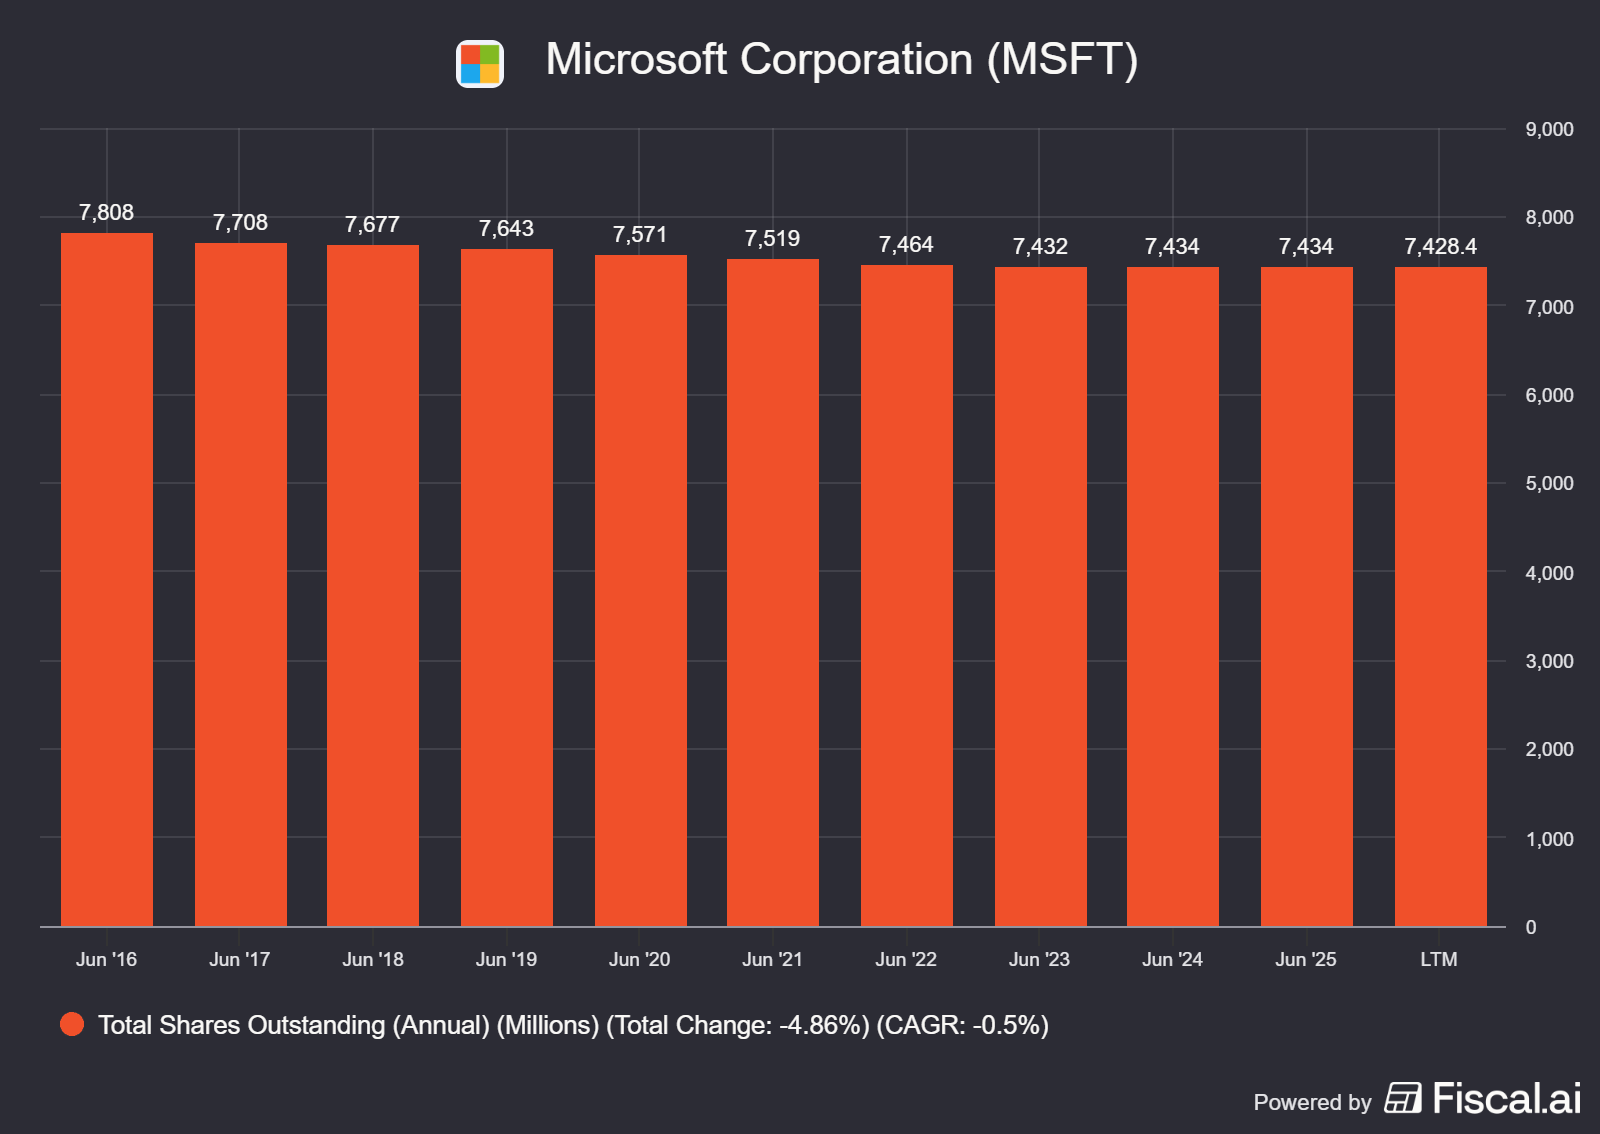
Share Count stable or falling ✅
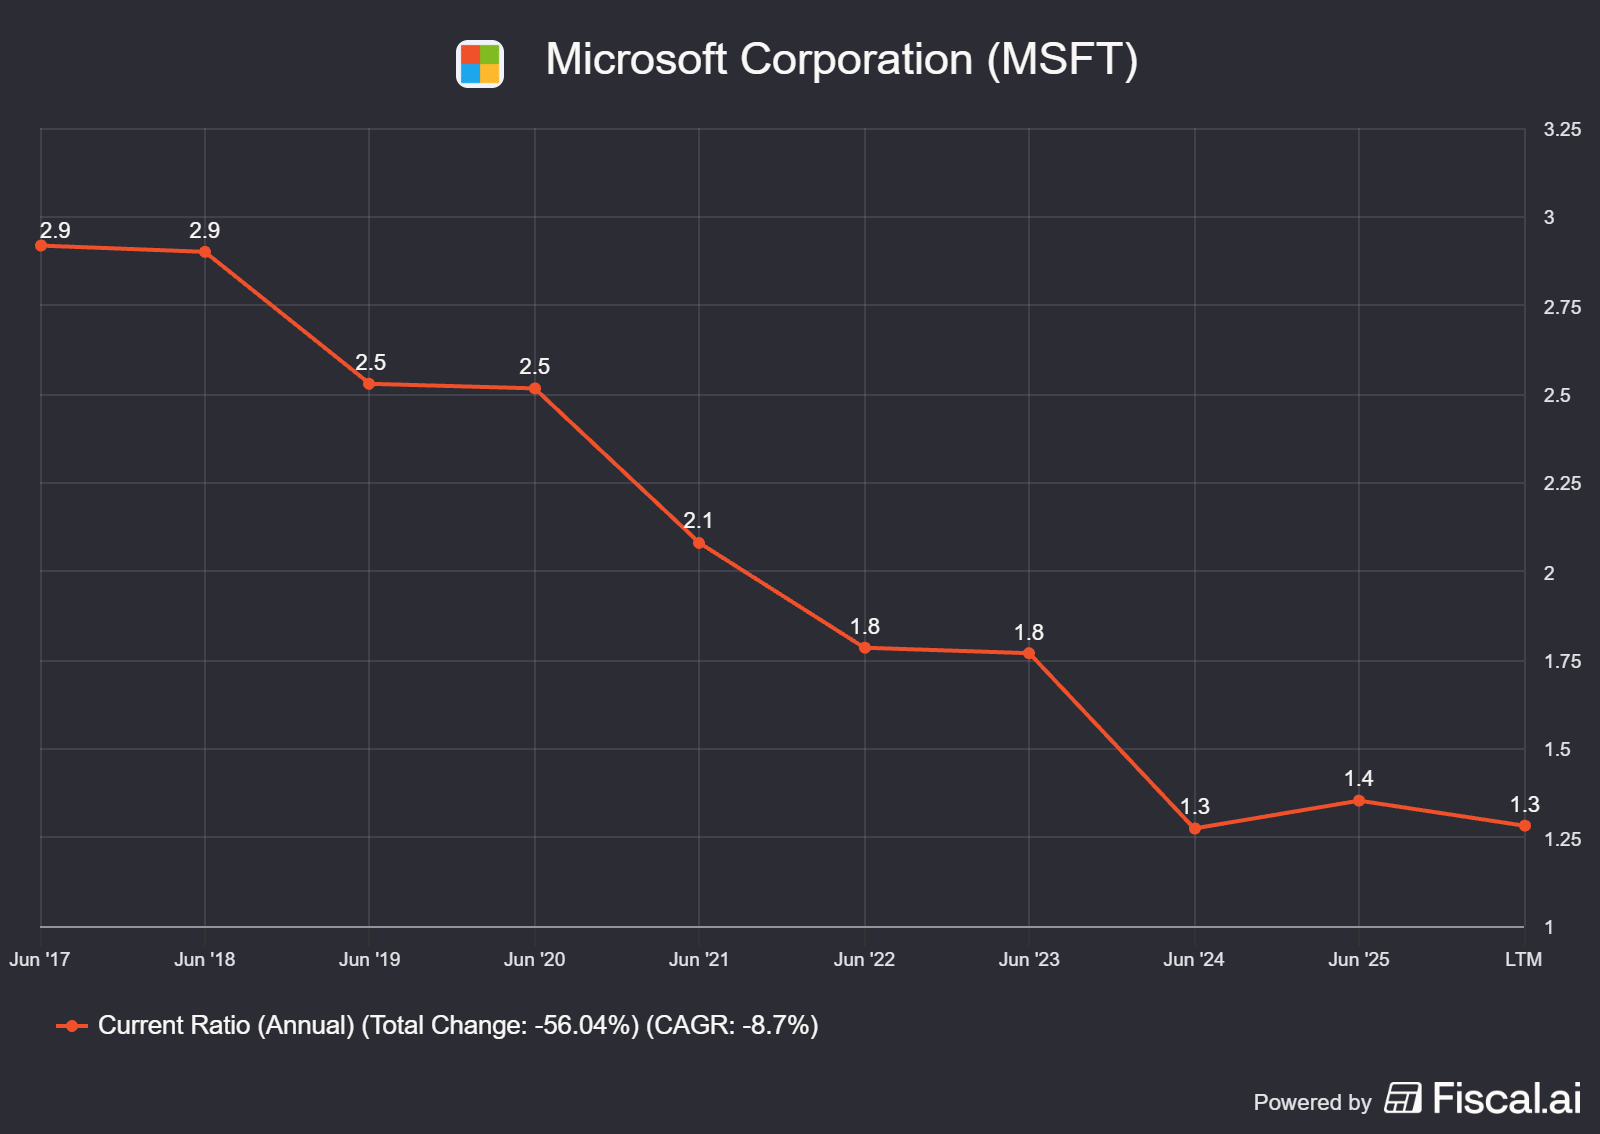
Current Ratio between 1.5 and 3.0 ✅ LTM Current Ratio: 1.3
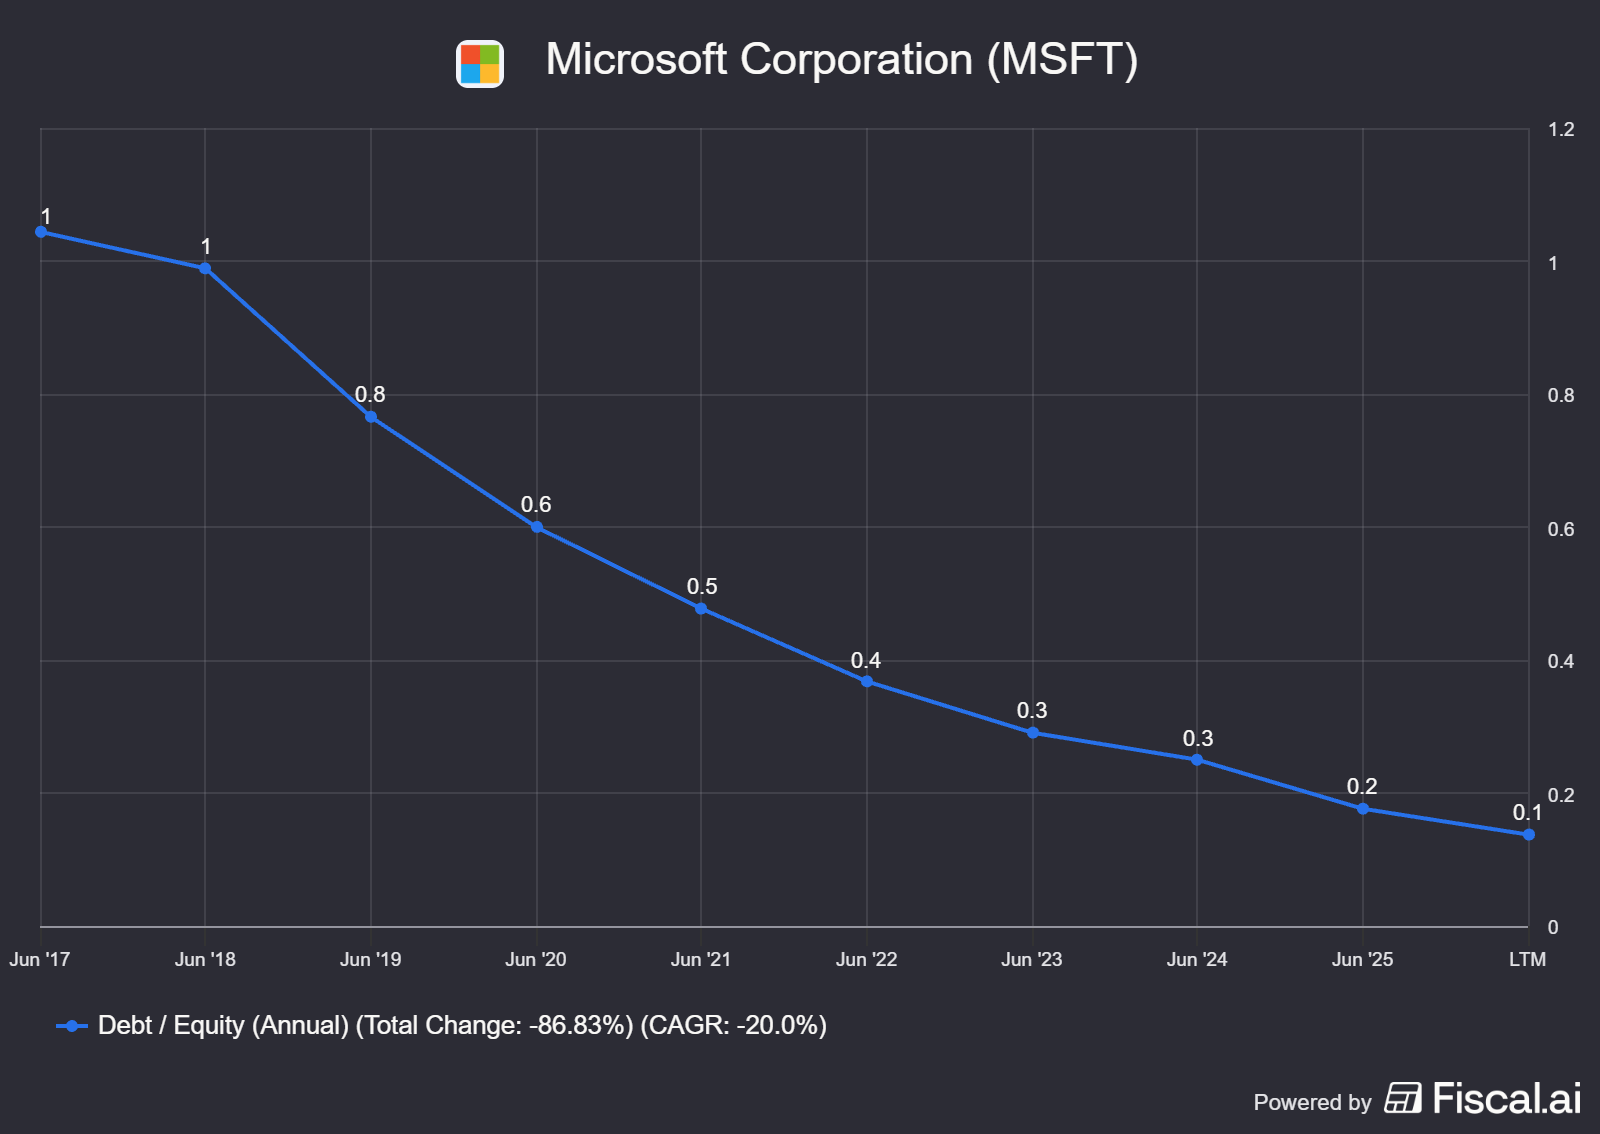
Debt-to-Equity < 0.5 ✅ LTM Debt-to-Equity Ratio: 0.1
9. Management & Governance
CEO - Satya Nadella
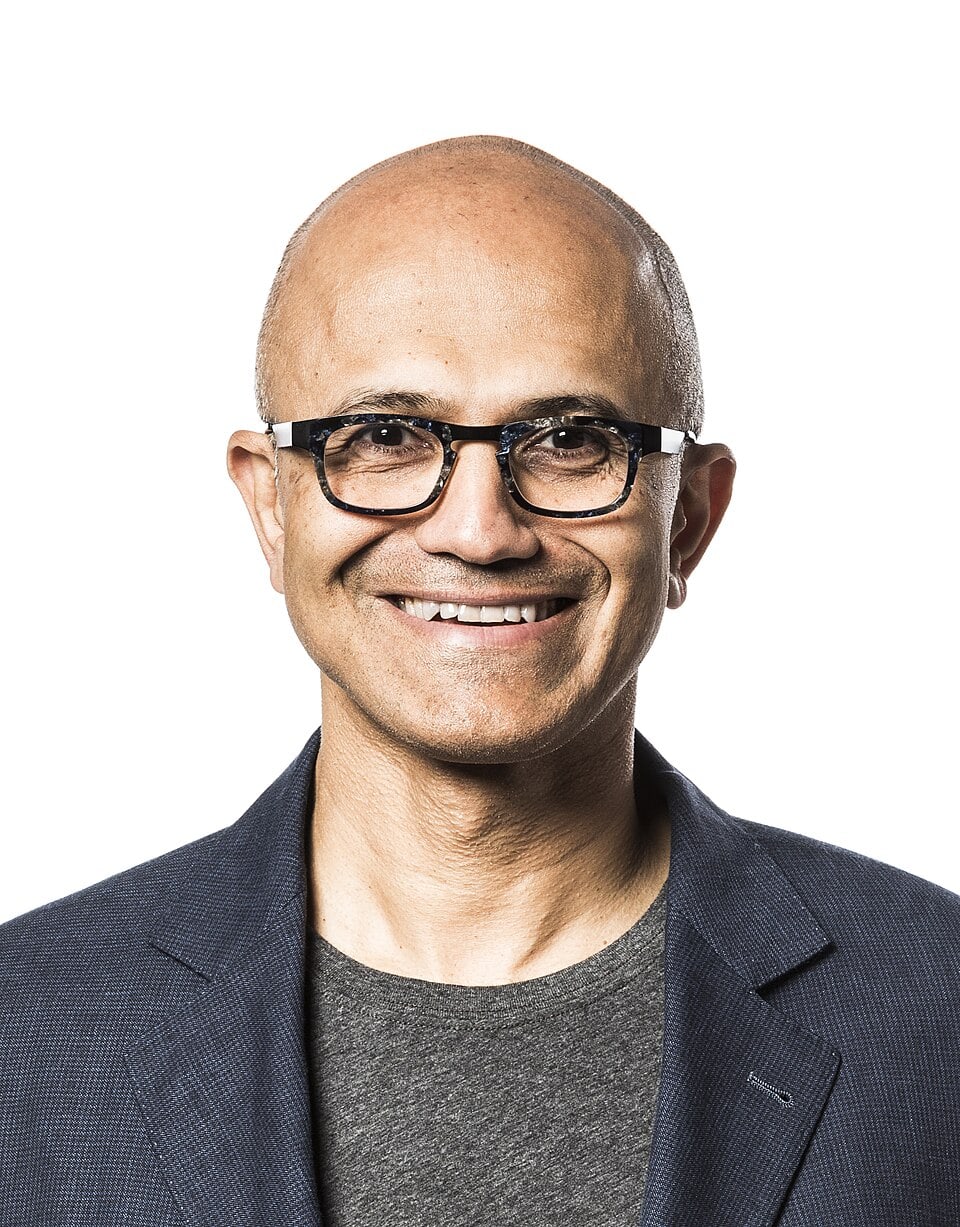
Satya Nadella has been CEO of Microsoft since February 4, 2014, and Chairman since June 2021. Age 58, he joined Microsoft in 1992 and ran Server & Tools and then the Cloud + Enterprise group before succeeding Steve Ballmer. His track record speaks for himself: since he became CEO, Microsoft has more than tripled revenue ($86.8B → $281.7B), quadrupled net income ($22.1B → $101.8B), and quintupled diluted EPS ($2.63 → $13.64). Cumulative TSR through June 30, 2025 was over 1,500% vs. 334% for the S&P 500, and market capitalization increased by nearly $3.4 trillion during his tenure. He crossed $4T market cap in July 2025, the second company after Nvidia to do so.
This 12-year track record matters because it’s the primary asset the market is trusting for the current CapEx cycle. Microsoft is asking shareholders to accept a multi-year FCF trough on the promise that the infrastructure buildout compounds into durable revenue. Every prior big bet Nadella has run (Azure, LinkedIn, GitHub, OpenAI) has hit or exceeded expectations.
The compensation for FY 2025 reached $96.5 million, up 22% YoY. Base salary $2.5M (unchanged since 2019), cash bonus $9.56M, stock awards $84.2M, and others $196K. More than 95% of Nadella’s target compensation is performance-based, his equity compensation is delivered exclusively through Performance Stock Awards (PSAs) tied to long-term value creation, with no time-based equity awards. Target PSA has been set at $50M since FY22 and has not been raised despite the market cap doubling in that window.
CFO — Amy Hood

Amy Hood has been CFO since May 2013. She was in the CFO seat before Nadella was CEO, which makes her one of the longest-tenured Fortune 100 CFOs. Age 53, Wharton and Harvard MBA, joined Microsoft in 2002. She has led the finance function through every major transformation of the modern Microsoft: the Nokia writedown, the Azure buildout, the LinkedIn acquisition, the GitHub deal, the Activision Blizzard close, and now the AI CapEx cycle.
Her contribution deserves specific attention for two reasons. First, the analytical depth she uses on earnings calls has become the primary way the market understands Microsoft’s AI monetization architecture. The “seat + consumption” language, the “roughly two-thirds short-lived, one-third long-lived” CapEx split, the “$25B of the calendar 2026 CapEx envelope is attributable to component pricing” disclosure, these are all Hood’s frameworks and they have become the reference points for how the sell-side models the business. Second, in Q3 FY26 she made a specific point that “many investors are doing a very direct correlation between the CapEx spend and seeing an Azure revenue number”, pushing back on the FCF trough narrative by insisting that Azure revenue alone isn’t the right lens for judging AI ROI.
FY25 compensation: $29.5 million, up from $25.8M in FY24 and $19.9M in FY23.
Incentive Structure
Heavy performance orientation. For Nadella, 95%+ of target compensation is at-risk. For the other named executives, the ratio is typically 90%+. There are no time-based equity awards for the CEO. This is better than most large-cap tech peers.
Long-term equity vests over three years based on Microsoft’s TSR relative to the S&P 500. The three-year rolling cycle means each year of a CEO’s pay is settled against a specific three-year TSR window. This is the incentive structure that has driven Nadella to prioritize durable value creation over quarterly hype, and it’s why the CapEx cycle is being executed with confidence. Nadella is being paid to see the cycle through.
Nadella’s Microsoft stock holdings were valued at $84.5 million at the end of FY25. Stock ownership guidelines require the CEO to hold at least 15x base salary in company stock. Hedging and pledging are prohibited for executives and directors.
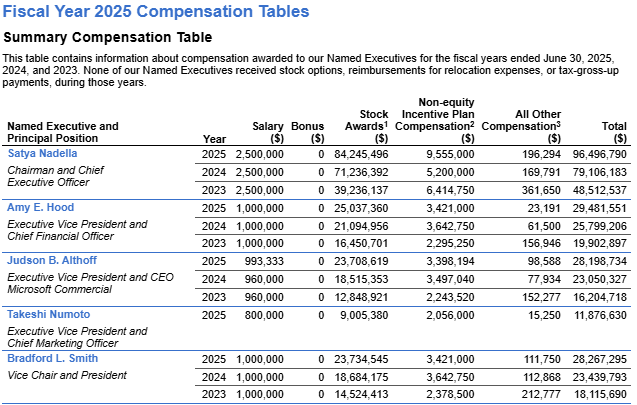
Source: Microsoft DEF 14A - Proxy Statement 2025 | Margin Valley Research
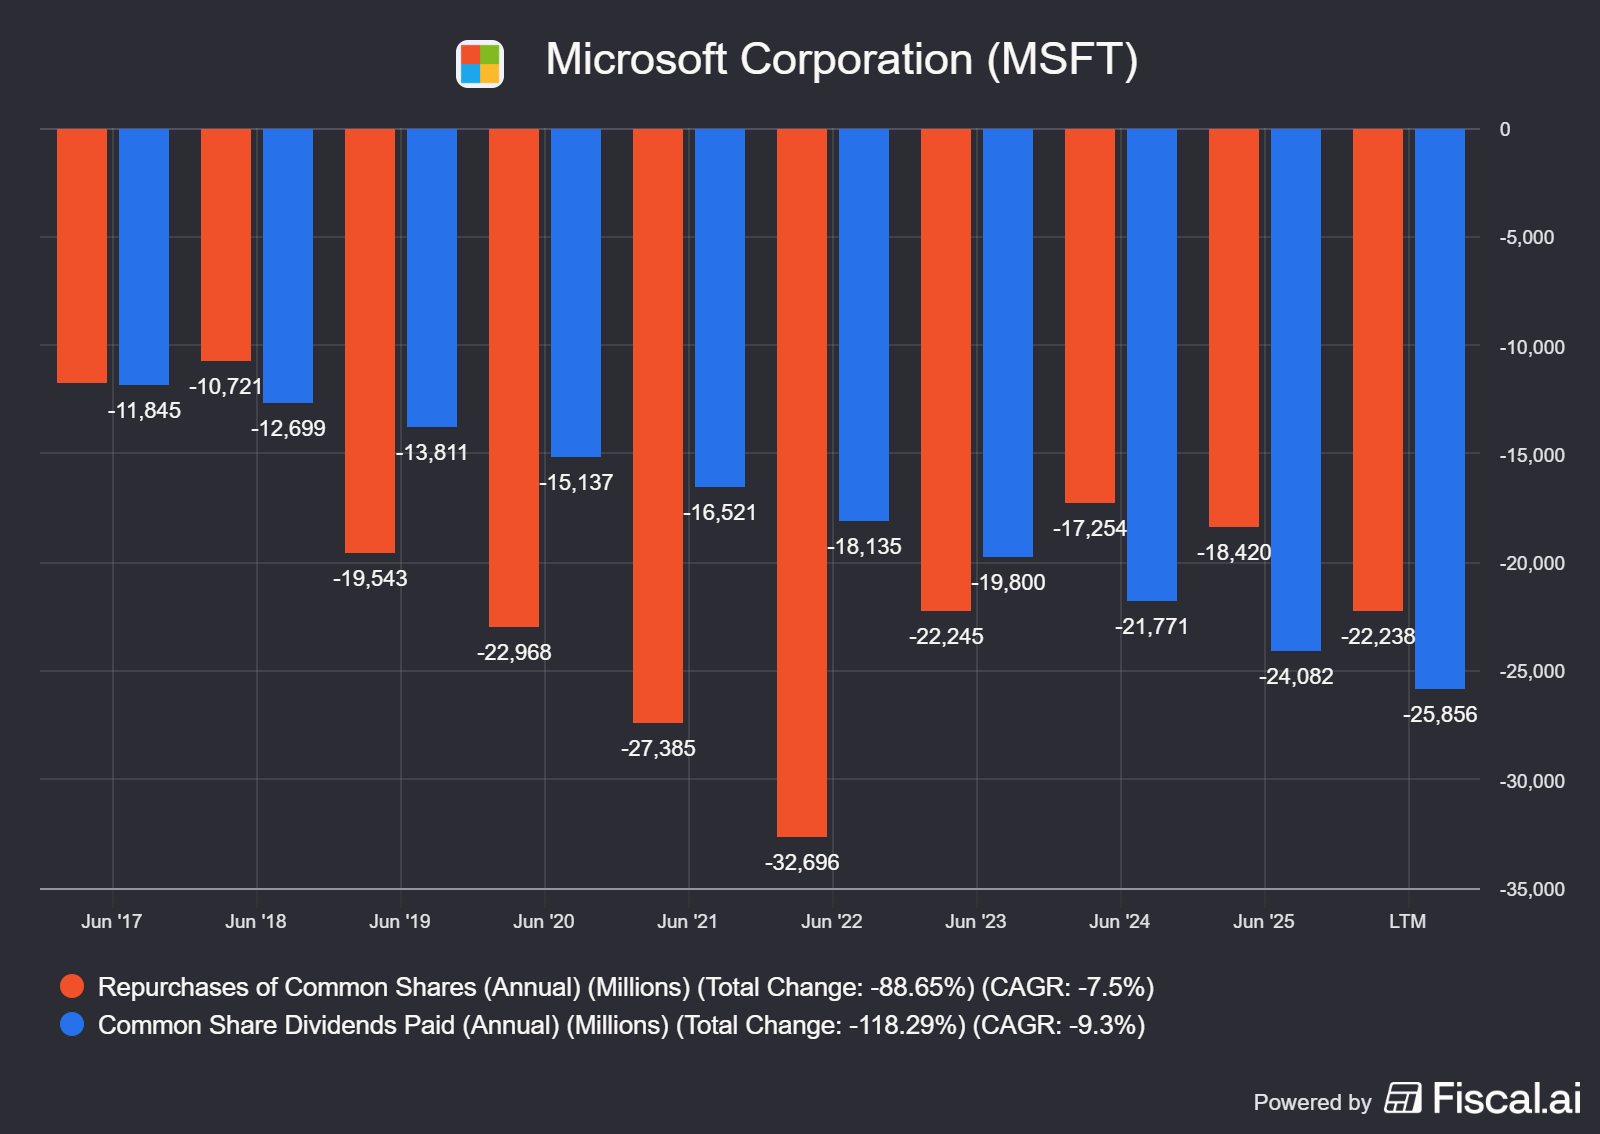
In terms of returning capital to shareholders, Microsoft keeps increasing dividends every year while the share buybacks are dependent on the investment cycle, and therefore started declining after 2022 due to the AI infrastructure buildout.
10. Risks
The biggest risk for Microsoft is competitors providing more value for customers and capturing the distribution advantage. Anthropic’s Excel and PowerPoint add-ins were very successful, but they were built on Office’s products. The problem is if these external AI-native providers start using this as a gate to later launch their own products and it diverts the distribution away from Microsoft.
Another risk is the ROI uncertainty of the $190B CapEx, most of which are GPUs and CPUs whose real economic lifetimes aren’t certain, and it later converts into operational and maintenance CapEx for an uncertain amount.
The last one is execution and pricing risk. E7 is still very recent, and it’s unclear how enterprises will react to the $99 price tag relative to the value Microsoft is delivering in exchange.
11. Valuation
DCF
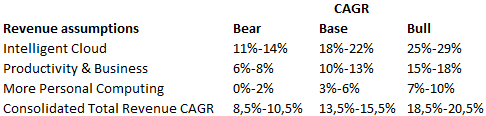
WACC = 8.5%
Intrinsic values:
Bear ~$333.2
Base ~$410
Bull ~491
For our portfolio we’ll use the Base scenario, which incorporates steady AI adoption, ongoing Copilot conversion into middle-market enterprises, Office 365 ARPU gains from tier upgrades, Azure normalization from 35-40% toward 20-25% as the base expands, and balanced CapEx levels.
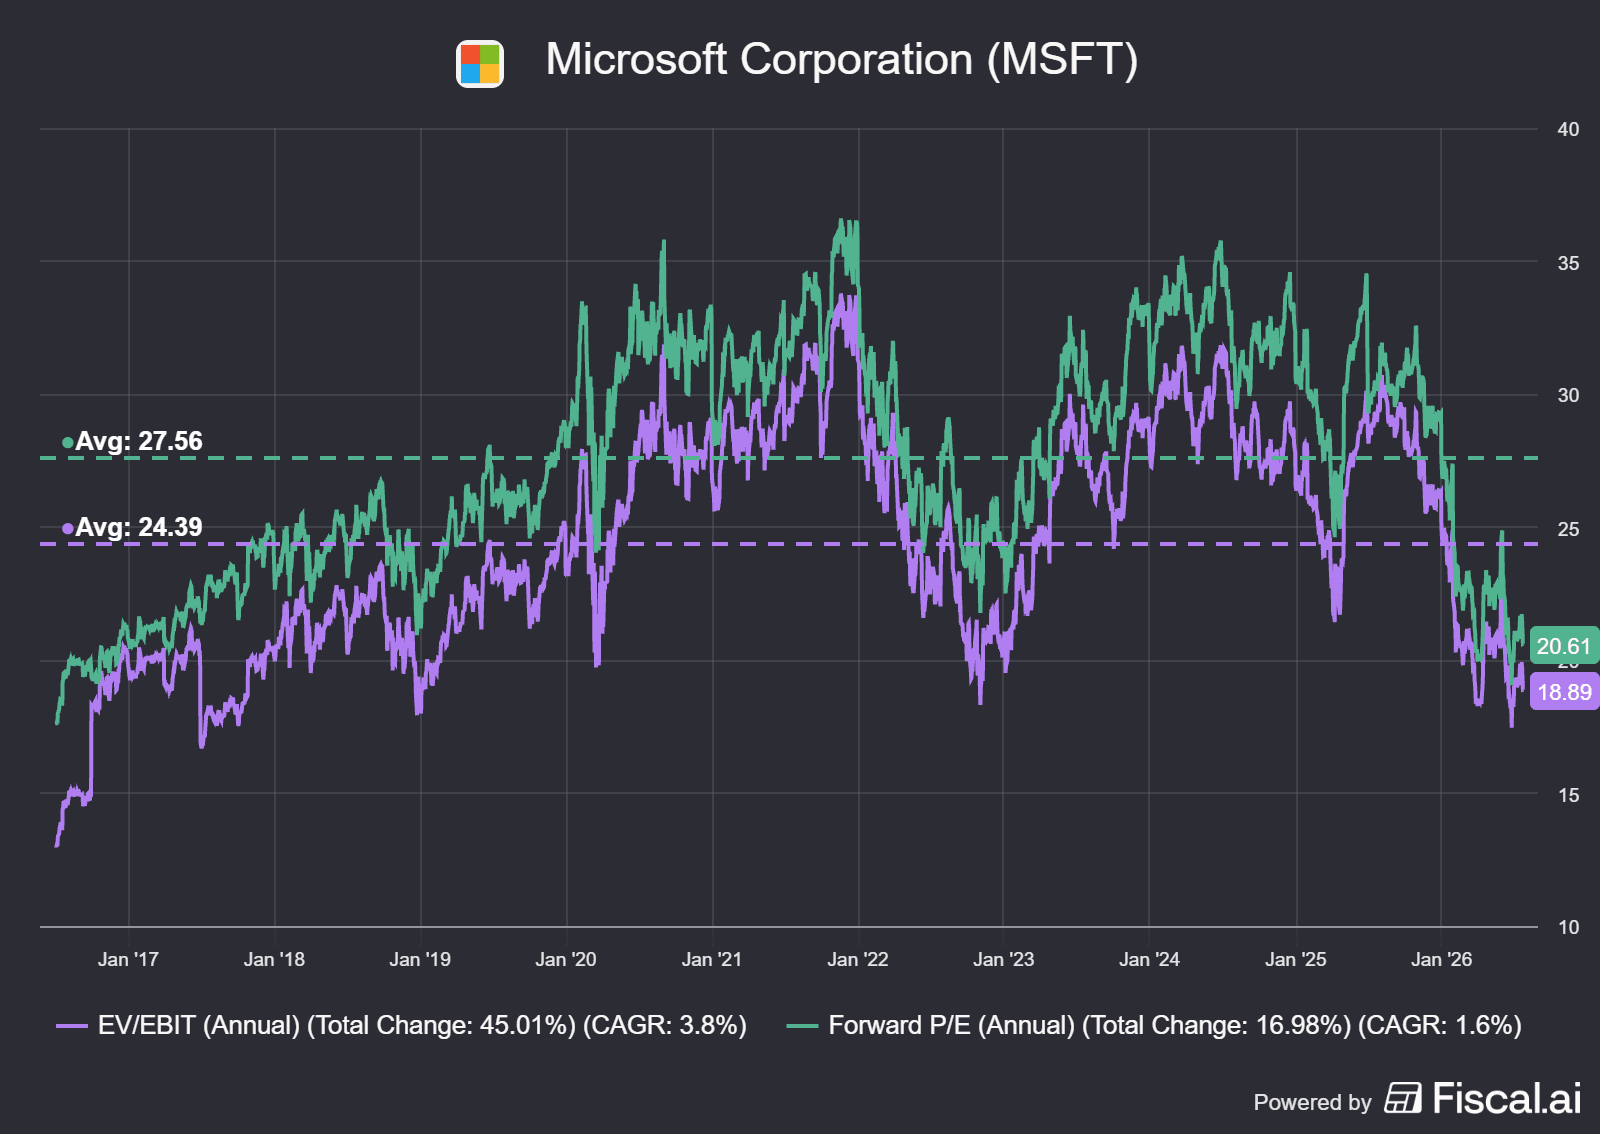
Valuation multiples over the last 10 years:
12. Conclusion
MSFT’s business model has been under stress due to market narratives for the past year, with PBP squeezed by AI-native productivity tools and Intelligent Cloud carrying the full weight of the CapEx debate. That’s no longer the picture. Two consecutive quarters of Azure reacceleration, the crossing of 20M+ paid Copilot seats, the E7 launch on May 1, and the completed shift to seat + consumption billing on July 1 have taken the air out of most of the bear case, and the selloff that followed made no sense to us. Our base-case DCF puts intrinsic value at roughly $410 per share on an 8.5% WACC, with Azure growth normalizing from the 35-40% range down toward 20-25% as the base expands. Bull case sits at ~$491 if Copilot conversion and E7 uptake track the top of our assumptions.
The thesis comes down to four things:
MSFT owns enterprise AI distribution. From custom silicon (Maia, Cobalt) through the Copilot layer to Agent 365, the whole stack runs inside a security and governance framework the enterprise already trusts. Plenty of strong models will keep shipping through 2026, from Anthropic to Chinese open-source players, and distribution wins in enterprise. External providers can build powerful add-ins on MSFT products, and they still won’t replicate 3.7 million enterprise customers and 60% of the Fortune 500 already inside the ecosystem.
Azure keeps compounding, and the contract book backs it. 40% YoY headline growth, ~26% ex-OpenAI, and a $625B RPO give MSFT the contracted revenue required to fill the capacity it’s building. The 45% OpenAI concentration is real risk, but it sits inside a contracted book with IP rights and revenue share extended through 2032, and the revised terms have already stripped out the exclusivity constraints that were the biggest overhang.
Copilot conversion sits at 4.4% of the installed base. 20 million paid Copilot seats sit on top of 450 million commercial M365 seats. The E3 → E5 → E7 upsell layered on the July 2026 shift to seat + consumption billing gives MSFT a revenue architecture where usage growth compounds on top of seat growth and tier upgrades. Convert 30-40% of the untapped base at realistic enterprise discounting and Copilot alone adds ~$25-40B in incremental annual revenue, with the consumption layer additive on top.
The Nadella-Hood combination is the primary asset for this cycle. A 1,500%+ cumulative TSR since 2014 across the Azure, LinkedIn, GitHub, and OpenAI bets. 95%+ of Nadella’s compensation is at-risk with no time-based equity, vesting against a rolling three-year relative TSR window. Hood’s frameworks (seat + consumption, two-thirds short-lived CapEx, the $25B component pricing disclosure) are now the reference points for how the sell-side models the business. Shareholders are being asked to accept a multi-year FCF trough on the promise the buildout compounds into durable revenue. This is the management team the market is trusting to see it through.
Our Microsoft thesis is straightforward: the AI stack is going mainstream inside the largest enterprise distribution footprint in software, and investors are pricing it like a legacy business on a capex bender. Forward P/E of 20.6x and EV/EBIT of 18.9x both sit meaningfully below the 10-year averages of 27.6x and 24.4x, and our base case already carries a conservative terminal multiple that reflects the higher capital intensity of the post-2023 model. The upgrade cycle from E3 to E5 and E7 is still early, and the impact shows up in two places: M365 Commercial gets higher per-seat pricing across tiers while Copilot attach rates are only starting to move, and with 57.8% PBP operating margins, that revenue drops almost straight through. Dynamics 365 is the other piece, where deeper Copilot embedding into ERP and CRM workflows should pull seats along and make the platform harder to rip out. That gives us a clear line to strong revenue growth over the next 12 to 18 months as the higher-tier commitments land in reported numbers.
A few notes on the choices. Our terminal multiple is deliberately below the 10-year average forward P/E because we wanted the base case to reflect capital intensity, well below the asset-light margin profile of the pre-2023 stack. The Copilot conversion range (30-40%) is also conservative given the 90% Fortune 500 adoption already reported. And we’ve kept the OpenAI stake ($200-280B mark-to-market) fully outside the DCF, treating it as optionality rather than as embedded value. If any of those calls land closer to the bull side of the range, the setup gets meaningfully more asymmetric than the base case implies.
Disclaimer: Margin Valley Research is an independent research publication focused on macro analysis and equity research. All content published on this Substack is for informational and educational purposes only and does not constitute financial advice, investment advice, or a recommendation to buy or sell any security or financial instrument.
The views expressed are solely those of Margin Valley Research and are based on sources believed to be reliable, but no representation or warranty, express or implied, is made as to their accuracy or completeness. Past performance is not indicative of future results. All investments involve risk, including the possible loss of principal.
Nothing published here should be construed as the provision of personalised investment advice. Readers should conduct their own due diligence and consult with a qualified financial adviser before making any investment decision.
Margin Valley Research may hold positions in securities or instruments discussed in its publications. Any such positions will not be disclosed on an individual post basis and should not be interpreted as a conflict of interest.
This publication is not regulated by any financial authority. By reading this content, you acknowledge that you do so entirely at your own risk.